Wednesday, July 15, 2009

GE Tour Editor: Snoovel


Via GEB I learnt of Snoovel, an answer to my lazy web suggestion that GE Tours would really be a lot easier to put together with a graphical editor. I've been in contact with Andy Schweiger from Snoovel about the development.

Pros: They've done some good things:
  1. Draggable Controls: the timeline has some advanced drag and drop and draggable boundaries to objects which is really helpful.
  2. Slick looking interface which is stylishly put together.
  3. Audio: Ability to add audio files is very useful. I have spent hours trying to hand code audio into tours and its a pain.

Cons: I have lots of little grumbles like the lack of a play head showing you where exactly you are on the timeline, but its a little unfair because this is a beta release. So I'll concentrate on some more fundamental issues:
  1. No ability to add or control KML content: Being able to turn Features on and off like Placemarks, Overlays, Screen Overlays and (especially) pop up Balloons is a key part of tours IMHO. Andy tells me that they plan to add this later but that there is an issue with the plugin then getting overloaded and crashing which users would then blame on Snoovel. Some kind of dash board indicator to show how overloaded the plugin is getting is the solution?
  2. No help files: Its disappointing that there's only a screencast to show you how to use the service. You may think this is forgivable since its a beta release - well that's a fair point but I think documentation is usually thought of only as an after thought in projects like this and its key to the usability of the service.
  3. Scenes and Points of Interest: The system Snoovel uses to control the look direction in the tour is to have what are termed camera views and to organise these into scenes. A scene is associated with a 'Point of Interest' (POI), Andy says this is to enable copying of scenes. I think users would be quite happy with copying scenes and from their point of view the POI just makes the process of producing a tour more complex.
Conclusion: Overall I think this a good service and I'm glad to see it out there, as Frank mentioned in his review, its the most sophisticated tour editor available to date. A good thing to experiment with if you're happy with beta versions, I look forward to seeing it develop.

Friday, July 10, 2009

Layar: Augmented Reality and GIS


Via Digital Urban I learnt of Layar which is a service for mobile devices that shows information using tools that sense direction and location. I'm not sure how successful this particular service is going to be but IMHO services like this, which add GIS data to normal views via Augmented Reality, are going to be huge.

Why? I think that the fall in popularity of Second Life vs Twitter shows us that the mundane (being able to read bits of text about other's lives) can be incredibly compelling.

Monday, July 6, 2009

Creating Tours HowTo 1

I've been working with tours a lot recently. I've previously blogged about how to produce what I called a simple tour, but I've decided to rewrite my advice based on my extra experience. In the near future I'm going to be writing a couple of these Tour HowTos, this first one is aimed at a level of use below than the earlier 'simple tour'.


A simple fly through tour: Producing a tour is wonderfully simple, an example would be a flight to show the physical landscape in the Grand canyon as in the video above. Effective instructions on how to produce such a tour are here from Google.

Producing a Smooth Flight: To produce such a tour you can simply use the mouse controls but you will get a better quality flight if you use a 3DConnexion mouse. If you don't have one or another way of improving the quality of the tour is to produce placemarks which serve just as camera viewpoints and use them to record the tour. To do this:
  1. Fly to the first camera viewpoint you wish to capture for your tour.
  2. Create a new placemark, name it something like 'View 1' and click 'OK'
  3. In the places column right click the placemark and select 'Snapshot View'. This associates the current view with that placemark.
  4. Fly to a new position and repeat from step [2]
  5. Repeat for as many viewpoints as you wish to create
  6. Now untick the placemarks you've created in the places column.
  7. double click the text of the placemark in the places column and you will fly to the view but without seeing the actual placemark.
if you double click these placemarks whilst recording a tour, a smooth flight to the camera view will be recorded in the tour. The tour can be made up of a series of flights between such camera views.

This isn't the most elegant way of recording a tour, writing the code directly would be better but many people don't have the skills for doing that in which case this is a sensible approach.

Thursday, July 2, 2009

Happy Birthday Blog!


This blog was two years old yesterday.

182 posts in that time with an emphasis in the:
Its been rewarding meeting up with people and finding that they follow my mental meanderings here.

Friday, June 19, 2009

Quick Links: 3D Thematic Viz, Bridges Tour and Tobler's Law

I'm not going to be able to do any blogging until July now but there's some outstanding links I wanted to share with you before I disappear.


Thematic Map in 3D: This visualization of mobile calls from Washington DC at the Obama Inauguration is fantastic. I'm generally sceptical about 3D thematic maps (example) but this visualization has a couple of features that get around common problems:
  • By using squares the surface illustrating call density is easy to perceive, if you used complex polygon shapes (e.g. US state boundaries) it would be less easy to perceive.
  • Lower density of calls is shown by cooler colors, height and also by increased transparency. Higher density by hotter colors, increased height and by less transparency. This means the pattern of calls is easy to work out , its a challenging visual task if just color and height are used.


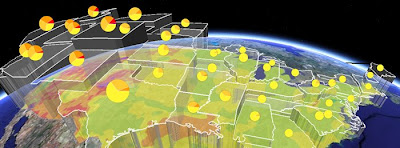
Interesting to compare with the Geothermal Project (shown above) which also uses transparency and height to illustrate a thematic variable but in a different way.

Fantastic GEarth Tour - Columbia Bridge: This project about bridge construction (via Google Earth Blog) is excellent. I particularly liked:
  • The bridges rising from the water effect
  • The use of pause at the start to give people information in the main screen about what they are about to watch.
  • Splitting the tour into 3 shorter sections reducing download time at the start and also catering for different user needs (some people will just be happy with the introduction, others will want more information)
  • The animation showing the problem of ships getting through the bridges.
I'll do a fuller critique later on.


Tobler's Law Discussion: Tobler's law is that things close together are more likely to be the same than things far apart. Very interesting discussion from Off the Map blog from Fortis One of the idea that we can apply the same idea to time and that with the new real time sensing capabilities feeding into maps (e.g. mobile phone tracking via GPS) we will see an exploration of this on the GeoWeb.

Thursday, June 18, 2009

The Patterns III: Virtual Globe

This is the final part of a three part series on Patterns on the GeoWeb (1, 2).

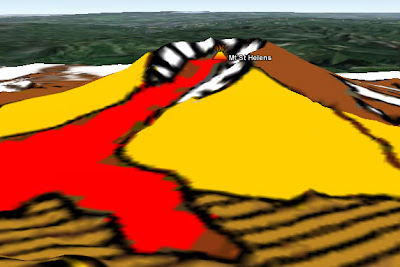
A screen Shot of the Mt St Helens Volcano in Google Earth showing an overlay map where red is the extent of a Pyroclastic flow.

What: Content designed to be viewed in 3D environment rather than as a simple 2D map. Virtual Globes such as GEarth are migrating into browsers and separate Virtual Globe clients are disappearing. The discussion in the post refers to both browser and client based Virtual Globes.

Use When and Why: The primary reason for using a Virtual Globes is the 3D nature of the visualization needed as in the screen shot, the map as a flat map would lose value from the 3D visualization shown. Other major uses of virtual globes include viewing the ocean floor from below sea level, the altitude and location of a plane's path and 3D buildings.

However, there are also other subtle reasons why 3D can be helpful. For instance, the Mercator projection of the globe which is used by map systems like Google Maps represents the arctic as a strip of white along the top of the map. If you are looking at the arctic as a whole then being able to view it from above the North pole as it really is represents a much better visualization.

I also suspect that being able to fly from place to place on a Globe helps people locate and orient themselves when they are taken to a new place when compared with zooming in and out on a flat 2D map. This idea needs further investigation.

Functionality not available in Browsers:
At the time of writing Virtual Globes also offer a range of functionalities not available in browser 2D systems. For example, Google Earth offers:
  • An easy way to mash data sets together (KML, but other formats are supported)
  • Producing tours for those who don't want to write KML directly
  • Accessing a range of data such as the multiple Google Ocean layers in the layers column
There is nothing to stop this functionality appearing in a 2D mapping system and really the situation is a legacy of how programs like Google maps and Google Earth client have developed.

How: Create KML:
KML can be loaded into GEarth client or using this gadget put in a web page via the GEarth API (no coding required)

Examples:
  • 3D buildings: Effiel Tower
  • Underwater tour: Part of this video


Monday, June 15, 2009

Ollie Bray on Google Earth in Schools


This is full of good ideas for using Google Earth in the school classroom. I do have one comment though, I think there is an issue with the true value of GEarth as a teaching tool compared with its visual wow! factor. The former is of long term use, the later gets attention now but in the near future, everyone will be used to it and will tire of it.

Examples from Ollie's talk: I think the pizza exercise (about 7 minutes in) where pupils trace the distance that all the ingredients components that make up a take away pizza is a winner. Really makes them think about geography and international trade in a very visual way. The smoke signal activity (2.45 minutes in) is fun once or twice but I imagine the 5th or 6th time students will start thinking it a little lame.

That being said one of the lessons I have learnt from being School Outreach officer for Geography here at Southampton Uni is that keeping attention of a class is much more critical than with our undergrads so maybe you just need to keep a set of such activities handy for grabbing attention.