Showing posts with label Aid or Environment Related. Show all posts

Tuesday, August 13, 2013

Geomorphology via Google Earth

Screen shot of a glacier from the file that shows dramatic changes over the seasons

I've just read a terrific paper by Holly Dolliver on using Google Earth to teach geomorphology (abstract, most of the body).  She mainly uses the historical imagery feature of GE to show the change in landscape with time and the elevation profile tool to show the topography.  She spent a lot of time searching out some great examples to illustrate her paper but didn't provide a KML file of the places so I've captured most of her examples in this file.

HowTo Notes:
The placemarks in 'Show Elevation Profile' folder need you to right click the placemark in the places column then select 'show elevation profile' to turn it on.

The other placemarks are related to time.  Follow these steps:
1] turn on historical imagery on the top bar in Google Earth by clicking the clock with arrow icon.
2] double click the yellow pins to be flown to the place in space and 'flown back in time

With Katama Bay, this illustrates long shore drift and I've left you to play with the historical imagery time slider ([1] above) as you wish.

Thursday, January 24, 2013

Google Earth in Award Winning Course

Screen shot of the Frozen Planet interactive map (Google Earth) showing permafrost layer
On Tuesday I went to a talk by Mark Brandon of the Open University (OU) about how they produced courses linked to the BBC ‘Frozen Planet’ TV series which was a joint OU/BBC production.  He had some great stories about what it was like to be involved with fiiming with the BBC at the poles with David Attenborough.

He described two courses:

  • A free online course (think MOOC if you don’t recognise the acronym, don’t worry) on the OpenLearn site (link from here but broken at present)
  • A short course

These are courses the OU produced, both of which he was involved in.  They were very sucessful in terms of student numbers breaking OU records and Mark explained how students completed tasks in Google Earth (API) as part of their assessments and also how it was used as a content platform. I was pleased to hear that for his work on the courses he won the ‘innovative teacher of the year’ award from the Times Higher.

Talking to him afterwards we agreed that the only real barrier to use by more university teachers was that they didn’t know about its capabilities, rather than it being too complex to use.  

Friday, October 7, 2011

Flood London's Bankers!

I was recently asked to produce something to showcase new big screened computers in a new media room at Southampton University.  VIPs watching including our Vice-Chancellor.  I revisited an earlier idea where I flooded London, I rewrote the code using an animated update to produce a tour which will raise the water from 20 to 200m in 3 seconds.


Open this

Flood London.kmz

and turn off all layers in the layers panel except 3D buildings which should be on.

1] Double click 'Space to High' and you will be flown from space to a high view over london.
2] Double click 'Flood London' and sea level rises from 20m above current to 200m
3] Double click 'High to City' to be flown to the city of London.  You should see the skyscrapers of London's banking center already partly flooded.  Turn off the tour (black cross in tour control, bottom left of main screen) then
4] Double click 'Flood London' and the sea rises again.  Experiment with controlling the tour controller bottom right to see you can become a virtual Canute. 

It shows two nice teaching facilities:

  • Animated update which will require you to get into KML if you want to do it for yourself in another location.  
  • A set of tours:  By combining tours which fly the user around with one which controls the flood level we can build some interesting visualisations.

Friday, July 22, 2011

How is the GeoWeb affecting the Climate Change Debate?

I was recently asked by a student from Southampton's Web Science doctoral training centre to comment on how the GeoWeb is affecting global warming. It's part of a larger study he is doing on how the web affects global warming and discussion about it. Here's my response as a blog post.

Data Visualisation: The GeoWeb has lowered the bar to visualizing data on the topic of Global warming and explaining the background concepts. Examples include Simon Rogers of the Guardian who is using fusion tables to visualise data on a map. See 34mins 33 seconds into this:


He explains how he can now produce useful map visualizations without needing input from specialist software engineers.

Unfortunately Simon hasn't used fusion tables to visualize global warming data (that I can find), however, fusion tables could easily be used to produce maps such as this other Guardian map: Carbon emissions by local authority in the UK. This kind of visualization has great potential as citizens can use them to make voting decisions by comparing their local authority to the others. Maps are very powerful in this regard.

Concept Visualisation: I've also used Google Earth to help visualise climate change concepts, the below clip is explaining Gaia ideas and I use Google Earth at 1min 13secs into this clip:


Mixed Concept and Data Visualisation: Google promotes the use of Google Earth in good causes via Google Earth Outreach, they have a showcase of climate related outreach projects based in Google Earth (click 'climate' link on the right when you reach the page). The showcase is made up of concept and data visualisations. Some of these are excellent such as the National Snow and ice Data Centre (NSIDC) but others could be designed a lot better e.g. 4 degree warming (my review).

Conclusion:
I think the GeoWeb has great potential to inform the climate change debate but at present, it hasn't been nearly as well used and discussed as use of the GeoWeb in emergency aid situations and helping the democratic process (e.g. Ushahidi). Despite having a personal interest in using Google Earth to explain climate change concepts, I think the best potential of the GeoWeb in discussing climate change is not in education but in lobbying politicians to live up to their rhetoric on delivering reductions in carbon emissions. A simple 2D map showing how much carbon dioxide is emitted by region is a fantastic tool to bring politicians and policy makers to account, I wish there were more examples out there of this use.

Wednesday, March 9, 2011

Fusion Tables for Volunteered Geographic Information (VGI)

VGI Background: There is a lot of discussion about Maps Crowdsourcing (or Volunteered Geographic Information - VGI) on the web at the moment. The excellent Geospatial Revolution clips are an example, this one discusses VGI as used by Open Street Map and Ushahidi in Haiti:


Note: Starts playing at relevant point in movie clip

I've just revamped a lecture for next week discussing VGI in depth and I wanted to get students to create and upload some VGI data but also to understand how to create a very simple VGI system. The solution was Google Fusion Tables.

Fusion Tables Background: For a while now I've heard Mano Marks amongst others pushing the geo capabilities of fusion tables (up coming where 2.0 example), this is the first time I've found an application for them. Neo-Geography is a term for all the new uses of interactive maps and map like visualisations appearing on the web, services like Google Maps, Google Earth are examples, they principally allow the public to visualise geographic data. What is so different about fusion tables is that they offer the ability not just to visualise but also to get into simple analysis of geographic data. Thus in Google Earth I can see Haitian refugee camps but with Fusion tables, it becomes easy to color code them by size. Fusion tables are also free and a lot more simple to operate than desktop GIS.

HowTo: Create VGI Thematic map: The following HowTo takes you through the steps of creating a database, uploading VGI data in the forms of polygons, defining a palette and outputting the result.

1] In GEarth digitise a number of polygons and give each of them a variable value (just 2 digits, no text) in the description box. E.g. I get students to digitise clumps of trees around Mt St Helens and give them a percentage tree cover value. Put all the polygons in a folder then save the folder as a KML file.

2] Go to the fusion tables site. If you do not already have a Google account you will need to set one up.

3] Click on File > New table > Import data > From this computer > Choose file, then upload your kml file. Click next then check the import columns include a 'description' column before clicking 'next' again to accept. Write a relevant description in the ‘Description’ box presented, then click Finish.

4] Your data should appear in a table with columns for description, name, and geometry. The Geometry column is the data Google Earth uses to draw each polygon, click on one of the kml labels to see the list of lat longs it uses.

5] Click on Visualize > Map. Your polygons should appear in a mashup using Google Maps, select ‘Satellite’ top right to see the true terrain. You will notice they are a default red at present. To create a simple thematic map we will apply a palette to the polygons colouring them a different colour depending on the percentage cover entered in GEarth.

6] Click on Visualize > Table to switch back to table view. Select Edit (on the menu bar) > Modify Columns > description > Type > Number > Save. This changes the percentages you entered in the GEarth description balloons from text to numeric values and you will see the description column right justify itself as a result.

7] Switch back to map view, now select Configure Styles (on the top of
the map) > Polygons, Fill colour > Buckets

Click the Radio button and on the pull down menu select 5 buckets. Select Column > description.
8] By default you have been given equal sized buckets (20% each), change them if you want. You should change the colours in the pull down menus on the right of the dialogue box to something appropriate. Click Save to apply this palette.

You should now see your palette displayed.

9] Now you have set up your VGI system, add others to the fusion table (share button top right of your fusion table web page > choose collaborators who can edit).

10] Get your volunteers to complete step [1] then access the fusion table and choose File > Import more rows to upload their own polygons.

Viola! A basic VGI system.


Wednesday, August 25, 2010

Current Projects: Haiti, Tours, Education and China

This summer has been very busy so I haven't got around to updating projects on my personal web pages. There are a number of projects that I'm working on at the moment that aren't listed and deserve a mention:

Haiti Maps Usability: I am supervising Luke Caley an MSc project student looking at usability of maps in the Haiti earthquake disaster, Luke is talking to people who where there at the early stages of the disaster investigating how maps and mapping were used in the field. There is a related area about the usability of crowd sourced map systems that is fascinating but unfortunately beyond the scope of this study.

Our theory is that Aid workers are a group for whom map usability is critical: when you publish a map on the web user's are only ever a click away from watching cats falling off sofas on YouTube. In an emergency situation the attention of aid workers is even worse - trying to figure out your map is time they could be using to pull people out from under collapsed buildings. So far the interviews seem to be showing that our theory is basically correct. Lots of organisations are generously giving time to helping us, for example ImageCat and MapAction. Final results are due in this autumn.

Google Earth Tour Research: Research is continuing into defining best practices for using tours in virtual globes (see 58:12 into this video for my talk on earlier work). Our results will apply to any virtual globe but for this study we've chosen to use Google Earth. Our main areas of investigation are into seeing how speed of flight and path geometry in tours affect the user's ability to track where they are within Google Earth. The video clip below illustrates the effect tour path has on user understanding, keeping track of where you are is easier on the outbound flight than on the return inbound leg:


User testing on students is planned for September and the results will be used in teaching materials. These materials will support students who will produce their own tours as part of a Southampton University GIS course. The study is funded by GEES.

Usability of Google Earth Materials in Education: I'm working with Declan De Paor from Old Dominion University and others on an NSF funded educational project where I'm providing input on usability issues. It's very early days on this project but Declan's examples give a good taste of what we're going to get up to.

China: I'm also off to China working with John Dearing and others where I'll be using Google Earth to communicate with Chinese farmers helping to alleviate poverty. Again, the project has yet to really kick off.

Next year is looking busy but exciting!

(update 26 Aug: Corrected Declan's surname spelling mistake)

Thursday, July 29, 2010

Next Climate Change Talk

Here's the latest release from a series of climate change talks I'm doing, this one discusses the Gulf Oil spill, the Athabasca Oil Sands and climate change:


Unlike the earlier 'Is the Earth a Super Organism' talk I've released so far in this series, this one is completely based in GEarth. It's 10th in the series but I've released it early as:
  • The spill is still ongoing
  • I wanted to have a go at a talk completely in Google Earth to showcase my ideas of what a well designed tour should be like.
I've made a Prezi to link to other resources beyond the scope of the talk:


Good Design Points: A few reasons I think this is a well designed tour:
  • The tour covers views across a range of scales, this is where a tour really beats a traditional PowerPoint presentation
  • Simple Flights: The flights between segments are simple and fairly slow to give users chance to process the movement and work out where they are being taken.
  • Scale: I included Nelson's column, the outline of Great Britain (twice) and a 5 mile long at various points to fix a sense of scale. GEarth is very good at helping users grasp the scale of things.
  • Annotations: I use lots of annotations to draw the user's eye to the correct part of the screen.
  • Dateline: Because the inbuilt GEarth dateline is too small I included a custom dateline indicator.
Things I'd like to fix:
  • Dateline is too small: I fell into the classic trap of looking at GEarth on a large screen then reducing down to a 640 wide movie clip - you can't read the text easily.
  • Audio Hiccups: There are a few audio hiccups that I'd like to fix but these aren't easy in Camtasia without affecting the video. I've got to get a better mic too....
  • Better Images: There are a ton of better images I'd have liked to have used but I haven't got the time to ask permission. Every image used is cc marked and that limits choice.

Work Flow: To produce it I imported models, images, overlays etc. into GEarth then I recorded a tour visiting all the locations as I wanted. Using the pro version of GEarth, I then recorded a silent movie of the tour which I imported into Camtasia. Within Camtasia I added the audio section by section, using freeze frames to extend the movie where needed and cutting footage to fit the commentary. I also added 'call outs' the red annotations which work in addition to annotations I've added in Google Earth. Its not an elegant technique but it avoids issues to do with GEarth tours such as not being able to review changes easily and needing to edit kml code rather than use the Camtasia graphic interface.

Friday, July 2, 2010

Climate Change Talks

Previously I've enjoyed releasing something good on GoogleEarthDesign's birthday (It was 3 this week) so here's my latest big idea:

Climate Change Talks: A quick search of the internets revealed no one has done a set of video clips on climate change for education (apart from illegal snippets of 'an inconvenient truth') so I decided to do some. Some of the later ones are matched to the UK A level Edexcel curriculum. Here's the first one on the topic 'Is the Earth a Super Organism'.


It's better viewed in HD

Format: Climate change as a topic requires discussing abstract ideas such as positive and negative feedback as well as map based graphics so I went for Prezi.com as an alternative to PowerPoint and added clips of GEarth tours where useful. When a lot of your presentation isn't actually spatial its better not to base your content totally in a GEarth tour as it presents difficulties. E.g. importing, sizing and adding labels to an image in Prezi is a snap with lots of drag and drop controls whereas its a pain to do as an image overlay in GEarth.

Having said that, some of the other clips I have planned which are completely spatial in nature will be done just as GEarth tours and recorded as YouTube clips.

Here is the original prezi page:
(navigate by using the plus minus buttons that will slide out if you mouse over the right hand side or use mouse wheel and click and drag)


It's rather like viewing a GEarth file after watching a tour of the content. In the bottom left corner of each frame it has links to related topics that don't feature in the talk.

Death to PowerPoint: Lots of people have criticised PowerPoint for its slide analogy format, I think you can still do some useful stuff with it but I see their point. The nice thing about Prezi is that I can produce a mind map like poster and then take you around with added audio by recording it with demo software (I use Camtasia 7).

Pros:
  • I like the zoomable interface idea Prezi shares with GEarth tours
  • Prezi is very usable and Camtasia is not bad
  • Doing it this way I like the way I can be discussing one set of points but adding arrows to link back to earlier slides of content.
Cons:
  • Using 3 bits of software is a drag (GEarth, Prezi and Camtasia 7) and is time consuming
  • I don't like the way Prezi.com promotes the idea of rotating text all over the place, I've heard reports it makes people feel sick.

Video Clips in Education: I had a long think about how to present this content and I thought it worth listing my inspirations:
  • Hans Rosling: Excellent speaker with great use of technology
  • Lawrence Lessig: Great speaker, interesting and unique style but I'm not sure I like how linear it is.
  • Ken Robinson: Amazing, totally absorbing using just his voice. Good to remember that technology is not what makes a great talk, its the talk itself and the speaker.
Very interested to hear what people think.

Thursday, February 18, 2010

Tuvalu Flooded in Google Earth


Tuvalu is a Pacific island famous for being vulnerable to global warming induced sea level rise. I've discovered in Google Earth, its already sunk a long way! A case of the model of the sea floor not being accurate enough in Google Earth. See more in this tour (needs GEarth v5+).

Other Sunken Islands: Previously I spotted the Scilly islands were underwater off the coast of Cornwall.

Friday, February 12, 2010

Global Warming, Snow and Ice tour


Lisa Ballagh of NSIDC wrote to point out their new 'Climate Change Tour of Cold Places', its a tour in Google Earth. She asked for feedback so I thought I would review it as a post. She also says she found my series of tour tutorials very useful, glad you liked them Lisa!

Overall Comments:
  • Good Work!: A lot of work has gone into this, overall I think its successful and informative.
  • Good Topic: Climate change of cold places is an excellent topic to tackle in a virtual globe because its very spatial (e.g. permafrost is more common closer to the poles). Also, people don't generally look at the poles on a globe so its good to get flown there to consider them.
  • Convert to YouTube: Given the amount of effort involved, I would definitely convert the tour into a YouTube clip as well. See discussion on this point.
  • Too Long: I think if NSIDC tracked how users access the tour they would find that its too long and that users were stopping part way through. 3 minutes is my guess as a good length of tour in this sort of instance, a solution is to split off the tour into separate parts as was done in the Colombia bridges tour.
  • Other Great NSIDC Content: On the same page as the tour page as the tour but lower down, the "Sea Ice: Daily Concentration and Extent" KMZ project is still one of my favourite GEarth projects.
Numbers in the next two sections refer to time in the GEarth tour itself

Pros:

  • Auto Play YouTube Clips: The use of youtube clips in the tour that automatically play (e.g. 8.47) is inspired. I'll be stealing that code and using that trick myself!
  • Good Start and End: Use of start screens, end screens, advice to turn audio on and which layers to select is well thought out.
  • Good Images: Good images have been selected for use in the tour, especially the retreat of glaciers.
  • YouTube Clips add Human touch: I think the youtube clips themselves add the human touch to the tour, making the content more accessible.
Cons:
  • (6.33) Fix Photos in Position: At 6.33 an image of Muir glacier slides across the screen showing before and after of glacial retreat. It would be better to fly into the Muir glacier and find the position from where the photo was taken and then overlay the before and after images one by one so they mimic the GEarth view. This gives users a sense of where the glacier is making it more memorable.
  • (7.12) Flight too Fast: Flights from A to B should be looped to include a high altitude view. This helps viewers work out where they've come from and where they're going. They should also be less fast than this one - most users won't follow where they are going at this speed. However, having said that, other flight segments within the tour were timed correctly.
  • (4.41) Split Attention: At this time the audio is describing something about glaciers while the placemark label asks the question, "why is Greenland called Greenland?". Users will be distracted by this, it's best not to split their attention, one way around the problem is to make the placemark only appear on screen when the audio track asks the question.
  • (4.41) Placemark vs Polygon: In discussing Greenland it should be marked as a polygon across the whole country with a camera view showing the whole country rather than the placemark shown at low altitude. A popup will work just as well from a Polygon.
  • (10.13) Timeline Labels and Annotations: To give viewers a sense of the time of events you could add labels for the times of each image. The timeline labels just aren't big enough to follow clearly. You could add annotations to show the physical scale (Rhode island outline over the ice?) and also add a polygon annotation to show the original extent of the ice shelf. The polygon island annotation should persist throughout the animation as the shelf disintegrates.
To summarise, this is a good tour with some innovations I'll be copying in the future. Although there are some cons I think they're quite minor points and don't distract from the quality of the work overall.

Tuesday, August 11, 2009

Brahmaputra Lesson Plan Update

Screen Shot of Tour. Click to Play, NB: Uses Audio

Over the last week or so I've been updating a lesson plan I published last year to use the new tour facility in GEarth. The above is an audio tour to show what the lesson plan is about.

New Materials: Download from my personal website under 'Brahmaputra Flooding....'. Features include:
  • NEW Delivered via tours making use much simpler for the teacher
  • Helpful notes on how to use GEarth for Newbie teachers
  • Ideas for extension exercises for students
  • Links human and physical geography considering effects of global warming
In the materials I've produced tours which use pauses rather than audio, the idea is that the teacher plays the tour and when it pauses describes/discusses with the class what is shown on screen - rather like a powerpoint where slide transistions are replaced by GEarth flights. I used the new material for a global warming conference to a 6th form I did in December and it worked extremely well.

Design Notes on the Lesson Files:
  • I added the 'press play to continue' screen overlay because I thought the user needed more visual feedback that the tour had paused/was playing.
  • I turn elements on and off in my tours more than most people seem to. I think its good practise to annotate tours to help guide the user's eye to where they should be looking.
  • I think the use of GEarth tours with pauses replaces the need for PowerPoint in this instance. Obviously it only works for certain situations but I know ESRI are developing even more tools to make other Virtual Globes more useful in presentations (you'll be able to import PowerPoint slides into their Virtual Globe)
Update 16:13, 12 Aug 09: Edited to include Frank's comments

Friday, October 10, 2008

Indian Floods

A while back I published a lesson plan showing the causes and effects of global warming on flooding in the Brahmaputra. Unfortunately the discussion was all to accurate and floods have been occurring in the region I discussed in the last month or so. Google have published their own Google Earth project showing imagery from August 3oth and 1st of September.

Here is a screenshot from my lesson plan:
this image shows settlements in the area, the color of the circle shows how 'sensitive' they are to flooding and the size the population.
this image shows the same area with a red overlay of what has been flooded from the google project. The two translucent areas show regions I identified in the lesson plan as;
  • North area: poor people living close to the river
  • South area: richer people living further from the river.
Design Point: The red color used is far too intense and isn't a natural 'water' color - dark purple or blue would have been a better choice. At the moment 'river of blood' is what springs to my mind.

Thursday, July 17, 2008

DVD of Data Shipped to the Field

Earlier this month I posted about regions. One of the uses I noted for this feature of Google Earth was that Aid workers could be sent into the field with a DVD of data in a region. This would mean they would not need to be connected to the web to use Google Earth so long as they were only using it to view a small region (e.g. around a refugee camp).

To illustrate the point a bit further I've recorded a video from the region covered by Crisis in Dafur, click the image to view:


Via Ogle Earth I found this post from Johnathon Thompson of Aid Worker Daily discussing how Google Earth could be used in the field with a poor web connection. His suggestion was that Google should let countries or areas beyond where he is interested in be blanked out, this would reduce the bandwidth needed to view the areas he is interested in. Unfortunatly the idea doesn't work, blanking out countries only saves bandwidth when you are viewing areas at the highest altitude, there will still be a considerable need for bandwidth as you zoom in.

Explanation of the Image Pyramid: To understand this you need to understand the 'image pyramid' arrangement of how Google Earth (and all other eMaps/Virtual Globes) loads in data . Lets follow what happens as you fly closer to the ground in GE*:
  1. You start by flying to a postion above Myanmar where the on screen view you see represents 1000 km x 1000km. GE loads in image A to render the view, this image is 1000 x 1000 pixels (pixels = dots that make up the screen) in size. You are viewing an image where 1 pixel represent 1 km on the ground.
  2. Zoom in to view a 500km x 500km wide sub section of Myanmar and GE loads in a new image (B) to render the view, image A is unloaded. Image B is also 1000 x 1000 pixel in size. It differs from image A because one pixel of image 2 is 1/2km or 500m wide. As a result the on screen view is more detailed.
  3. Fly in further so the on screen view is 250km wide and GE unloads image B and loads in image C: it is also 1000x1000 pixels in size and in this even higher detail image 1 pixel represents 250m on the ground.
  4. Pan across to view the land area to the East of image C and GE loads in another 1000x1000 pixel image (D) to render the new region. Because you have flown no higher or lower the resolution of D = that of image C.
If you consider Johnathon's idea it would only impact the first view when we were looking at image A. Lets say we save downloading half the pixels of image A. However, as soon as we flew down into the country we would lose sight of all the other countries surrounding Myanmar so all the pixels making up images B, C and D, would still need to be downloaded in full. Note that all the images are the same size so image A only represents 25% of the total download GE needs, so applying Johnathon's idea we only avoid downloading 12.5% of the pixels.

Johnathon goes on to say:
"I have a heard a number of times that caching imagery is a viable solution to the bandwidth problem but the reality is that most folks have no idea how to cache imagery" (emphasis is mine)
Help is at Hand: Well that's OK Johnathon, data on a DVD can be easily arranged so that all the user in the field needs to be capable of is opening a Google Earth (KMZ) file. All you need is a techie like me to arrange it for you, DVDs with the KMZ could be copied multiple times and cached data spread to whoever needed it. With some programming work, the process could even be automated so that some non-techie on a good, cheap web connection could produce a DVD to be sent to the field pretty much at the click of a button.

He also says that:
"when the fabled ‘DVD full of imagery that gets shipped to the field’ solution comes up it takes about 30 seconds to convince the other person that it is really just a nice idea that has little basis in reality" (emphasis is mine)
Am I missing something? I'm not sure if that just refers to Aid Workers not being techies and not knowing how to cache data or if there is some other barrier to this idea I've missed? I've worked in Aid situations so I thoroughly understand that there can be no expectation of specialist GIS skills in Aid workers.

I am interested in pursuing this idea further, if anyone has a case study area they'd like to volunteer and ideas about funding I'd be happy to collaborate.

*This is a very simplified version of what actually happens in GE and I've made the numbers simple to make the point but it is broadly the way GE works.

Thursday, July 3, 2008

Brahmaputra Flooding Lesson Plan

Day 4 of 'Release week' ...

Screen shot from Google Earth of dykes by the Brahmaputra River

This is a lesson plan using Google Earth to explain the problems of flooding in the Brahmaputra river in India. Flooding has become more of an issue because of global warming and the lesson plan explores the reasons why and also explains the effects of the flooding.

1. Ice and Floods, Google Earth File

2. Effects of Flooding, Google Earth File

3. PDF instructions

It's been written in conjunction with Staff from the Brahmatwinn project who are studying the problem and Anne Sroksy Program tutor for Geography teaching here at Southampton University.

Points about teaching:
  • Designed principally for UK teachers but I've tried to make it useful for use in any country.
  • Its split in two to give a logical break to a lesson in case it gets over long.
  • I've designed it so it gives helpful tips on how to use Google Earth as you progress through the lesson. It assumes no advanced Google Earth skills on the part of the teacher.
  • Google Earth is particularly good in this context as it can be used to drape images over mountains, gives students a sense of orientation/scale automatically and plays videos in placemarks.
  • The plan is not prescriptive about whether Google Earth is used by the students or by the teacher in show and tell mode - either can be done.
  • I plan to do more lesson plans, feedback on how it works in practice would be really useful.
I also want to publish a video clip of Dr Craig Hutton who is very knowledgable about the project area introducing the issue of flooding in this area but that will have to wait awhile.

Monday, June 30, 2008

Holographic Google Earth

No one else seems to have picked up on this in the Google Earth community so:


Holographic Google Earth from Nicolas Loeillot on Vimeo.

More details its by lm3labs.com (which deserves to be sent to websitesthatsuck.com for bad web page design IMHO).

Unfortunately the holograms don't seem to be in 3D, I'd love to know if they're working on a 3D version.

Tuesday, June 24, 2008

Regions: Excellent Feature if used Wisely

In an earlier post I described my problems with how people are using the regions function.

Reiteration: The Hidden Treasure Problem - if you have hundreds of placemarks (or other features) making up a large data set in a Google Earth project its a problem to render (get your PC to draw) them on screen without overloading the graphics card. The regions feature allows you to set a box in space - if the user's viewpoint is within this box the placemarks plot, if they aren't, the placemarks are hidden. If you split your placemarks into lots of these boxes, then you only see placemarks in your area and you get around the large data set problem. All very good. Problem is people are using the regions function without giving users a signal that there is hidden data within the boxes, so you could fly too high to see placemarks and not realize anything was there at all. I suggested an overlay of a magnifying glass icon was a solution.

In a video from the Google I/O conference, Bent Hagemark refers to regions (14 minutes in)

you might like to watch it with the slides in better resolution here

He notes the hidden treasure problem and suggests marking the position of hidden data with a placemark. I suspect my overlay idea is better but lets not quibble. He also describes how to arrange a series of ground overlays so that when you fly in Google Earth increases the resolution. This is done using regions, low res large area images render at altitude and Google Earth shows high res small area images only when you fly low. This is a great idea which doesn't suffer from the hidden treasure problem. There are three applications of this idea which spring to mind:
  1. In an emergency situation (say for the Chinese earthquake) NGOs want to view satellite data of the area they are working in but often have only intermittent connection to the web. You could send them a USB key with a KMZ file containing satellite imagery organized by regions*. There is no need for GE to be online and you could also provide updates not available in Google Earth itself - e.g. up to date imagery after a Tsunami strike showing which roads and bridges have been destroyed.
  2. If you have a wide coverage of thematic maps you could arrange the maps in regions so that the user sees higher resolution thematic maps as they fly in. To illustrate the image below is from an earlier post, it shows two thematic maps: one large low res and one small high res image. By using regions you could get the large map to render whilst the view is at altitude but as they fly in a series of the smaller maps appear.
  1. Picture Frames that only appear depending on your altitude. E.g. details of how to negotiate road blockages after a Tsunami in placemarks ('The bridge here is down but the river can be forded up river 2km, I've drawn a path to show you the route', ). You wouldn't want to see all the details in a high altitude view but by 'flying' your planned route at low level you could plan how you were going to do it.
As with many features available in Google Earth, regions are excellent if used wisely.

*Interestingly, this is actually how the base data in Google Earth itself is organized.

Thursday, May 22, 2008

TMapper: Thematic Mapping Tool

Executive Summary: We have produced an early version of 'TMapper', a tool that will allow the generation of thematic maps with Google Earth. It is designed for humanitarian work so it has the following characteristics:
- Does not require constant web access
- Simple to use, understanding KML not necessary
- Works with any user generated set of polygons and palette
- Automatically produces a key and the processed polygons can be queried in the main Google Earth window.
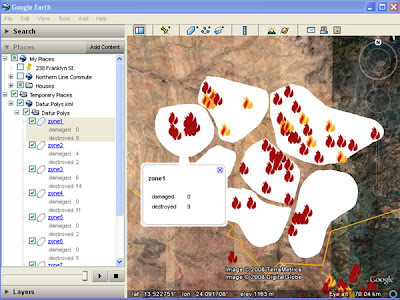
Raw Data: This is a screenshot of user generated polygons* with a simple html table of data in each polygon. In this case the data are the number of damaged and destroyed villages (from the Dafur Layer) in each polygon. Note that you cannot click the polygon to get the description like a placemark, the polygon description has to be accessed through the places column.
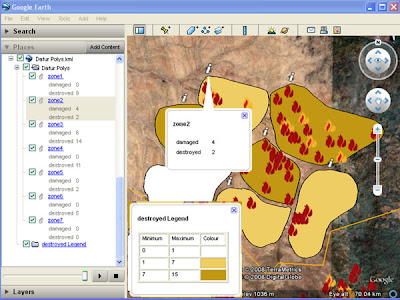

Processed data: After using the tool, the polygons are converted to a color coded thematic map, a key is automatically generated and a 'i' placemark produced which can be queried from the main screen to show the data. (note for simplicity the legend has been copied in afterwards, in real use the legend appears center screen and legend and pop up balloon cannot be visible at the same time)

Relationship to GIS: The idea for this tool came from discussions with Nigel Woof of MapAction and my boss Dave Martin. In GIS a lot of data is stored as attribute tables attached to Polygons, e.g. a table of the number of male/female/sick refugees is linked to a series of polygons showing refugee camps. This is a useful format but not possible in Google Earth. After discussions with Ducan Hornby of GeoData (who has done all the coding) we decided to have a go at producing a tool that could enable this.

Scrappy Maps: The original idea was to allow an Aid worker in the field to produce thematic scrappy maps , this means that TMapper must be usable in areas of poor web connection and should be simple to operate. E.g. a worker helping in the China earthquake disaster can quickly digitize the borders of a series of reservoirs and attach data such as distance from earthquake epicenter and volume of water.
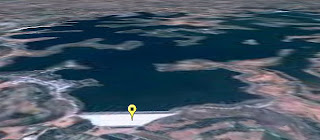
View of a Dam and resevoir that could be damaged due to the recent Chinese Earthquake, taken from Mark Mulligan's Dam GeoWiki via Ogleearth

Two separate thematic maps can be produced (one for volume one for distance) using our tool and compared by using the layers control in the places column.

Related Work: Bjørn Sandvik has produced some thematic maps in Google Earth but he uses php which requires web access or a fiddly PC based server. Kaitlin Duck Sherwood has produced Mapeteria which also produces thematic maps but that requires a web connection and only works for predefined polygon sets.

.NET and KML format: Part of the justification for doing this was that Duncan wanted to explore working with .NET VB so our tool is written in this language. After defining a palette, the tool writes a series of polygon styles that color the fill of the polygons. Individual polygons are linked to the styles depending on the value of the variable in their descriptions. The tool produces the 'i' placemark via multigeometry (another multigeometry example) . Finally, the tool automatically produces a KML folder with a simple html table in the description which has a key in it.

Demo: A demo of the tool in action
(note big download)

Next Steps: We would like to release the tool but we are having installation issues as the program appears to be fussy about the version of .NET installed so these need to be cleared before release. We would be grateful of feedback from the developer community about choice of alternative language to produce this in and the Aid community in terms of its applications. Further work would see us produce a key via screen overlay, get the 'i' to plot itself just inside the polygon rather than outside and allow palettes to be saved for reuse.

*I just made them up, they could be river basins or administrative districts.

Friday, April 11, 2008

Google Earth Outreach UK Launch Part 2

So I had a great time yesterday at the Outreach launch. When I arrived there must have been 250 of the great and good of the NGO world sat waiting to hear how Google Earth could be used to help them. As I said, David Attenborough was inspiring, he is a fantastic presenter, after watching him all through my life on the small screen it was distinctly odd to see him talking in the flesh. I won't report all the other 'launch' speakers as I have seen them before and they have been blogged elsewhere, which was fine because I'm sure they were new to all the NGO people present.

So how come I'd got in? Well, I'm consulting for USHMM but also I hang out a fair bit in the Google Earth outreach forum helping people with problems. Its also a bit of a hark back to an earlier life for me, in the 90s I used to work as a water geologist in Africa and as part of that was seconded to Oxfam for a while and they had we working on a refugee site. When I got back I was helping WaterAid asess a new tool for finding water

I spoke to people from iraqbodycount.org , WaterAid (who launched their new layer) and others. There seemed to be a belief that Google Earth could be used to help with outreach which is wonderful to see, I've always thought that Google Earth could be used wonderfully in this way and it is fantastic to see a growing awareness of the opportunities amongst non geographers. It has to be said that Google do know how to throw a party too, the food and service was wonderful and they had built up the event by inviting some great speakers and keeping the layers quite to generate interest. There was a lot of press there.

The other week I discussed HowTo use movie clips instead of Google Earth in a talk. It's a time consuming process capturing the clips, yesterday a lot of the speakers used live demos of Google Earth and had it crash or slow right down on them which is why I don't think that a live demo is the right approach. I remarked on this to one of the Google speakers and he seemed to imply that there was value in showing how the software behaves warts and all. I can see his point but I think in front of such a big audience you have a responsibility to make everything run smoothly.

In explaining this blog and the importance of design to another Googler (who will remain nameless) I pointed out that the latest UNHCR layer uses red and green triangles as different classes of icon that 6% of the population won't be able to distinguish (a point I hope to elaborate sometime in the near future). 'Are they different colours?' , he said,'I'm red green color blind myself and I thought they were all the same icon'. Nuff said.

But the final word should go to John Snow from Channel 4 news who was there to help field questions after the moring 'launch', he did a great job but then thanked Google for showing us all these clever 'gizmos'. Rebecca Moore who heads up Google Outreach joked that she'd tell Larry and Sergey that that was what he thought of their tools.

update: link to forums led instead to USHMM. Thanks for the heads up Frank

Thursday, April 10, 2008

Outreach Launch in the UK

I'm blogging this from the launch of Outreach at the Google office in the UK. At the moment Sean is showing the spreadsheet tool, sorry Sean, I love it already so I'm doing a post.

Outreach is about helping NGOs (non government organizations such as charities) to use Google Earth as an outreach tool. This morning there was a talk by Sir David Attenborough launching ARKive, he told a story about how he first filmed the Komodo dragons for the first time and later in the day we saw a movie clip from Google Earth of the dragons from within GE. The highlight of the day for me so far has been his quote:

"Google Earth is an amazingly powerful weapon that we all can use to protect our planet"

couldn't put it better myself.

Sorry for the lack of links but I'm doing this from a machine that isn't my own laptop.

This blog isn't about breaking news like Stefan and Frank (Ogle Earth or Google Earth Blog respectively) but I am finding it kind of fun reporting on something that they are missing. Hi guys :)