Showing posts with label Usability. Show all posts

Monday, January 9, 2017

Three Geo-Animations for Atlas Tours (Google Earth Tours, Esri Story Maps)

Just less than a year ago I published a post about 3 types of Atlas tour (1).   I've been thinking about the topic over the last year as I've been writing papers so I thought I should develop that post with some more detail.  I discussed this in my recent Google Education talk.

Types:
Just as you can have different types of PowerPoint (fieldwork briefing, photo slide show, talk etc. etc.) you can have different types of Atlas Tour.  Esri Story Maps (ESM) have identified a number of different types which emphacise text narrative, I believe most Atlas Tours should be narrated using audio, so I'm not going to discuss those.  My sorting works on two axes:

  • 3D or 2D:  ATs can be used to discuss both landscape (3D) or map views (2D).  
  • Realistic base map vs Symbolized:  showing realistic imagery works well when illustrating landscape but symbolising is endlessly useful in paring down a map to simlyfy it to the elements needed (e.g. temperature and wind but nothing else bottom right below)  
which produces 4 groups.  These are illustrated in an image grid below (2):


I give examples of the four groups in this videod section of my Google Education talk recently.

Geo-Animations
Within an Atlas Tour, you can have different types of animation that are highly suited to the format, I've identified 3 which I think are particularly useful and to illustrate them I've prepared a story board of an Atlas tour discussing the famous Snow cholera map:

1] Map Sequence:  using annotations or revealing layers (build animation) of a map one by one in order to explain a complex map.  The sequence above illustrates the build animation with street names added and then the pump.  It becomes much more important on complex maps.

Click to expand.  The audio narrative script is found under each image.


2] Time Animation:  Showing a sequence of maps to show change due to time.  This is well discussed in the cartographic literature.  Note that I've invented data, the spread was actually not recorded.
Click to expand


Avatar animation:  flying down from a symbolised map view into a 'human' view.  This is an original idea of mine and IMHO is very powerful, you can illustrate spatial relationships and then follow up with showing what they look like in real life.  In this case, on the street.

Click to expand


these aren't the only animations you can use and you can certainly usefully link out to static imagery and non-map video from within a Atlas Tour.  However, they are all very spatial and so worth highlighting above other formats in an Atlas Tour.


1] at the time I called them Google Earth Tours but to include people interested in using Esri Story Maps I now use Atlas tours as an encompassing term.

Thursday, October 20, 2016

New Paper: How to make an Excellent Google Earth tour

We (myself and Artemis Skarlatidou) have just submitted a paper to a cartographic journal about a successful experiment we did on users' understanding of Google Earth Tours.  The work produced two rules of thumb to consider when making Google Earth tours so I thought I'd blog about it.  Note that the title of this post isn't how to make a 'cool' Google Earth tour that grabs users' attention, this is about how to use them as an effective communication tool.

Why should I care about Google Earth tours?
Before we get to the two best practices its useful to think about the media we're discussing.  Is it worth using?  My answer to that is that Google Earth tours are common on the web and the wider generic group of Google Earth like animations (Atlas tours) are everywhere!  e.g.:
- TV (e.g. weather forecasts)
- The web (e.g. National Geographic)
- Mobile satnav apps

As an example of Atlas tours in satnav apps, both Google Maps and Apple Maps in driving directions mode will zoom into tricky road junctions when you approach them but then zoom out when you are on a straight road section to show you the wider view.

So you should consider creating a Google Earth tour (or Atlas tour if you prefer) as a way to tell your spatial story.

Best practice 1: use high paths
If you are producing a tour with two or more low points, you get to choose how the camera moves between the two low views.  Users' mental map of the study area will be better when your tour following a 'Rocket' path(1) where there is a mid point where you can see the start and end of your tour. This video explains the point and tells you how to achieve it technically in Google Earth:


Best practice 2: use of speed
We haven't explicitly proved it but an animation speed of 1 second for any camera motion is a good rule of thumb(2).  If the tour is more visually complex, you may want to slow the speed down.  Reasons to take more time:
- You are flying through a complex 3D cityscape
- There are lots of elements on screen (points, lines, areas) that you want users to understand

As an example, these are some of the experimental Google Earth tours; only the 'low, fast' condition really troubled the users in the experiment.


Conclusion:
Atlas tours are very common as they are an effective media to communicate a spatial story or data.  Google Earth is one of a suite of software that can be used to produce Atlas tours, I think the principles described here will apply whatever software is used.

I read all the studies I could find in 2011 and produced an earlier paper which discussed these and 17 other best practices for producing Google Earth tours.  This is the shorter blog version of the paper.


Notes
1] In the paper, this is called the high path.  Less memorable but more professional sounding.

2] our experiment ran at speeds slower than this and user's had little problem building up a mental map of the study area.

Friday, January 29, 2016

Microsoft Mix - first look

Warning:  nothing about maps, just of interest to educators.

So I've come across office mix this week, its an add on for MS Powerpoint with a linked cloud hosting service.  I've had a play and I think its a definite force to be reckoned with.  It does the clever trick of combining:

  • Easy audio and slides creation
  • Easy written materials with links and video embed creation
  • Self assessment quizzes 
  • Polling 
  • Easy cloud management (no ed tech help needed!)
  • good tutorials 
  • AND you get learner analytics 

The analytics is a big plus, you can see if a certain student has accessed your mix or gone only half way through. You can also see if most students skipped a slide and see if it was good or not.

The only downsides are: -

  • Functionality for students on mobile devices (tested on iPad/iPhone) is reduced a lot - you have to convert to a movie and you lose interactivity
  • I’ve found it a bit ropey in places e.g. fails to upload once in a while, analytics behaving oddly at times.
Some ideas for what you could use it for:
  • Recording skype tutorials for those who can't make it
  • Create some screencasts of Powerpoint content and then have a quick feedback survey at the end to gauge how your students found them
  • Give feedback on essays by screencasting you looking at their essay and adding ink onto their scripts
very much worth looking at.

Thursday, June 19, 2014

Are men better than women at navigating in virtual 3D spaces?

I have a PhD student Craig Allison who is looking at spatial understanding in maps and related 3D spaces.   He entered and won the faculty round of three minute thesis', a public speaking competition to see who could present their work best in three minutes with one powerpoint slide.  This is his talk at the final of the event competing with other PhD students from around the University.

Navigation in 3D Spaces: He covers the importance of designing 3D spaces well to assist users navigate them and the gender differences that he has found in his experiments.  It's especially relevant to anyone designing virtual field trips using tools such as streetview and/or Sketchup.


Sad that I couldn't make the talk to support him, great work Craig!

I've marked the location of the Psychology building he discusses if anyone wants a look.

Monday, June 9, 2014

What Features should a Teaching GIS have?

Sorry for the quiet on the blog, I'm only just surfacing after a lot of marking and teaching this semester.

In this post I'm going to explore the features needed to make a simple GIS for school level education. There are a lot of new services available that are excellent opportunities for educators (e.g. ArcGIS Online and the Google family of services [review]) so I think a consideration of what features a dream edu-GIS would have is a useful thought experiment.

How would we use a Teaching GIS?

My idea would be a simple introductory GIS that would be suitable to use outside of Geography, e.g. to support a biology project looking at the spread of trees in a forest.  The tool would be simple enough that students don't really need to understand they are using GIS at all, it would just work.  To teach students about GIScience itself, rather than just using it, you'd probably want another tool.  

Working with this constraint defines the general area of functionality we want to cover, we are not thinking about GIS analysis functions (e.g. calculate how many trees are within a particular polygon), we actually need GIS just to visualise the data.  


What Features do we need in a Teaching GIS? 
So now I've defined the scope of what I'd expect my edu-GIS to achieve, we can dive in and think up some functionality lists.  I've assumed there are various features common to all GIS already inherent in my all GISs such as layer control, data importation, navigation tools.  Beyond those needs I've come up with two lists:

Must Have:
  1. Usability:  This isn't a feature but is listed as IMHO it's the prime consideration.  Whatever other features are available they must be robust, easy to understand and easy to use for students. 
  2. Collection via Mobile devices:  The GIS must allow users of mobile devices with GPS's to go out and collect data via customisable forms and upload the data seamlessly to a shared map.  E.g. users go out in the forest with smart phones and log locations of different tree species which then uploads to a central map.
  3. Photographs:  There should be a variety of ways of easily bringing photos into the map.  In Google Earth these are screen overlay, balloon pop up and ground overlay.
  4. Symbology Styling:  The major groups of symbols (points, lines, polygons) should be available and it should be possible to change the style of a symbol depending on an entered variable.  E.g. a bigger icon for trees bigger than 10m.  There should be suggested colour palettes for shading but also the ability to customise colour completely e.g. illustrate tree species with shades of green but then highlight one particular tree species using a bright orange.  
  5. Attribute Table:  Related to point [4], it should be possible to access the spatial data as a table and be able to edit it, e.g. for one tree change its height from 20 to 30m within the GIS.
  6. Base Maps:  It's important to have an option to chage base maps for different purposes e.g. with lots of data you want to plot it on top of a subtle map that doesn't visually complicate the view.  In other situations you may want to use satellite data imagery as your base map.  
  7. Map Overlays:  Images should be possible to import as map overlays, e.g. bring in an image of an old map of London and overlay it on the existing topography.  
  8. Layout Tools:  It should be possible to add titles, a legend, a scale bar and annotations to a map in a simple way to allow it to be output as a well made static map.
  9. Story or Tour Tools:  There should be tools for constructing 'video' like stories with an audio narrative.
  10. Export:  The raw data and styling data (data about how the map is styled such as title size) should be exportable and be possible to import into a non-cloud service such as ArcGIS or QGIS.  This allows students to backup versions as they go along, if something goes badly wrong with the cloud file they are working on in the edu-GIS then they can use an older version elsewhere.

Also Could Have:
  1. Streetview:  A great bonus for education is the ability to be able to snap in and out of 'real world view'
  2. 3D:  Having true 3D rendering as per Google Earth can be very powerful e.g. in looking at conditions on mount Everest but for most applications, 3D is actually not necessary.
  3. Cross Section Tool:  A very useful addition in lots of applications but not core.
  4. Group working:  This is natural advantage of all cloud applications.  Being able to collect data to make a map is a core function number [2] but beyond that, IMHO group working on a map is not really core unless you are in a distance learning situation.
  5. Models:  Having 3D rendering of buildings can be very useful but, as with the point about 3D, it's not core.  For Geologists 3D models are much more important but I wonder if it would not just be better to build a separate program for making these sorts of models, do they have to be within a GIS?
  6. Historical Imagery:  A great resource for an edu-GIS but the patchiness of good data limits its use much as the fact that streetview is mostly consigned to public roads at the moment.  
  7. Time animation Features:  Very powerful but on the edge of what is possible within a school teaching situation, its quite abstract to get students to put these together.
  8. KML:  To explain this point I'll consider the Google Earth situation:  for power users, it is endlessly useful to be able to access the code that controls the data itself (KML) and manipulate it outside of Google Earth to go beyond the core functionaility.  For example, I have spreadsheets that I can use to produce KML outside of Google Earth and import it in, for example, creating custom Google Earth tour flight paths and speeds.  This extends the power of the GIS beyond the functions that are built in.

This is a quick, from the hip, set of thoughts.  It would be interesting to hear what other's agreed/disagreed with on my lists.


Friday, October 25, 2013

Google Earth Tour Builder Review

Previously I couldn't get GETB working*, I've worked out a work around* so now I have so a fuller review for you:

The tool is at https://tourbuilder.withgoogle.com/

Firstly, a little shout for joy is in order:  YESSSSSSSSSSSSS!  It looks good.

Some History:  A week before I saw it I was trying to get a funding bid accepted to build pretty much what this is, and I've been banging on about the need for it for years.  Other's have had a go at this (see previous post) but nothing has come close to filling the need IMHO so well done whoever 'withgoogle.com' is.

Educational Uses:  I get students to produce Google Earth tours on two courses, I think as an assignment it really works, I've showcased an example of a student's work previously and I think its such a neat teaching tool that I gathered some thoughts from colleagues on the idea (under 'Space stories') at a conference this summer.

What GETB does:  Previously you could record a Google Earth tour in Google Earth but if you wanted to edit it, you had to get into the KML code.  Also, fiddling around with lots of elements in the places column was tedious and you ran out of space quickly.  With this tool you can define a series of locations and then upload images, compose text or link to videos related to each location.  You do it 'in the cloud' as your tour is saved in a location related to your Google account so to edit, you must be online but you have the advantage that you can access your tours from any online machine.

Once you've created a tour, you can edit the sequence of location by simple drag and drop.  The interface is very clean (inheriting look and style from Google's standard interface design) and its very intuitive.

Nice Touches:  

  • Rocket path: When flying from low location to a distant far location the path loops high following the rocket path rather than staying close to the ground surface (crow path).  More detail under best practice 13 here.  Nice to think someone reads this blog :)  
  • Hidden Titles:  I also liked the way the control column hides the location's title unless rolled over with the mouse.  
  • Streetview:  drop a location in streetview and the tour will use streetview when played.  
  • Slide Metaphor:  Google Earth tours in Google Earth play via a VCR controller.  GETB uses a slide metaphor which is easier to understand and navigate when playing a tour IMHO.  It also makes editing easier.
  • Import KML:  This feature allows more advanced features to be associated with a location (e.g. polygon annotation) but the complexity that goes with this is hidden from most users.  One of the problems with the earlier attempt at a tour editor Google Earth Studio was that the complexity was visible to all and was overwhelming for users who just wanted to do something simple.


Missing Features:

  • Audio: With so much going on visually in a tour, its best to deliver the narration via audio, which you can do with Google Earth tours.  More details.  I'd suggest this is an important feature to add.
  • Overlays:  A powerful feature of tours is to be able to incorporate ground overlays in the main screen.  At the moment you can add polygons and lines by importing KML but it won't import KMZ's which would allow overlay imports.  E.g. a screenshot of OpenStreetMap which would be far less visually complex as a base map than the standard satellite view of Google Earth.
  • Tutorials and support?  It's nice and straightforward but help files would really open up its use to a wider audience and GETB is definitely suitable for non-techies.  

Overall, brilliant.  I will be using with my students ASAP


*doesn't work: chrome in Lion.  On Snow leopard with chrome it works

Thursday, August 1, 2013

X-Keyscore Map: 10 Redesign Ideas


In terms of map design, the X-Keyscore map makes school boy errors from start to finish so, inspired by Victoria Nece's redesign of the PRISM PowerPoint, I thought I'd have a go at 10 design improvements that I hope my students (Geography at Southampton University) would suggest.   I've also been meaning to give Google Maps Engine Lite (GMEL) a spin with a view to using it in teaching so I'm killing two birds with one stone:  having fun giving the spooks a cartography lesson while also testing the capabilities of GMEL.


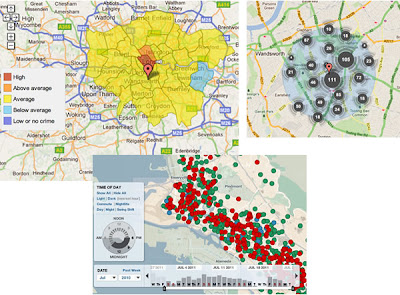
Screenshot of part of my revamp of the X-Keyscore map.
I used GMEL, Full size, zoomable version here

Need to Digitize   I only had the map to work from so I digitized the points as well as I could.  No way of knowing if I got them all in the right places...


X-Keyscore Problems and Solutions

1] Base map too saturated: Having a saturated base map (rich colors with multiple shades showing) is bad design, it interferes with seeing the data plotted on top.  See point 2 for solution.

2] Base map showing too much data: Also, no need to show vegetation type and hydrographic depths, it doesn't add anything and just clutters up the map.  Using GMEL I chose a more muted base map, e.g. it doesn't have hydrographic data anymore.  I'd have liked to have just had one color for the land too but this isn't possible.  In fact, my perfect base map for this task would have just three gray tones:  one for sea, one for land and one for borders.

3] Icons too large:  Having the icons large causes overcrowding, icons merge into one another and its difficult to differentiate them (more detail).  The simple solution is to make them smaller.  Using GMEL you can't control icon size which is annoying so they stayed about the same 'default' size.

4] No border to icons:  Linked to the overcrowding, if you add a border the icons 'pop out' from the background more and also its possible to have a go at differentiating them when they crowd together.  In GMEL its easy to customize icons and they come with a black border as standard.

5] Red/Green color blindness:  1 in 20 men cannot easily differentiate red from green so its best not to have red symbols on a green background.  I've used purple to get around this.  Changing color in GMEL for icons is easy.

6] Red Dot Fever:  Intense red stands out well but is overkill on a simple map like this.  Also your map looks like it has measles.  You can have paler dots that still stand out and this reduces visual complexity.  With only one data type this isn't crucial but when you start adding more layers (such as the countries in point 10), visual complexity becomes an issue and its good design to keep things as unsaturated as possible.

Another example of red dot fever also produced in 2008

7] What's with the dots by Antarctica?  Have they ringed the continent with floating stations to keep those penguins in check?  I assume its stations they didn't want to mark on the map in which case, they should have been pushed to a column off the map marked 'Stations with no Location', this would be less confusing for the users as there would be no way that they could think the markers had a location at all.

8] Title too big:  It takes up too much space and is too visually busy, although you could argue that's an issue with the PowerPoint, not the map.  In GMEL I can't control the title design.

9] Extra Information:  I think the total number of stations and the total number of countries covered is a key part of this map and it hasn't been mentioned.  I added it onto the map in GMEL by creating another layer, marking two points in the Pacific and letting labels be visible.

10] Mapping which countries are covered:  relevant to the above, I think adding the countries covered would add weight to the argument that the coverage is very wide.  I wanted to be able to map countries using a drop down list, i.e. map Ecuador from a drop down list using GMEL but there doesn't seem to be an option to do that so I hand digitized the countries covered in South America as an example.

More on GMEL:  I think this task has been a bit unfair on GMEL as it's not really there to produce static maps, its really about creating zoomable dynamic maps.  In addition, its best selling point (IMHO) hasn't been used:  The ability to easily edit the data producing a map as a table e.g. add columns as necessary, and to apply palettes of colors depending on the values in the table.  This is a very powerful tool for data exploration.

Overall, GMEL is very straightforward to use and I think it has potential as a teaching tool.  However, some features I'd like to see:
- Symbols' size editable
- Political map option for base map (see above)
- A way of easily importing in countries, states of the US, counties in UK etc so data can be added to them or they can be customised as needs be.
- Ability to add labels.

If you want to have a play with GMEL there's a tutorial here.


Thursday, November 1, 2012

Eye-Tracking Zoomable Maps


This post was joint authored by Paolo Battino and Rich Treves.

One of the evaluation techniques we said we would employ in our Google Research Project (links to search query) is eye-tracking.  Eye-tracking software is usually designed to record the position of your gaze on the screen, assuming the content of the screen only changes in a predictable manner. This means that current eye-tracking software is good for understanding actions on a web page e.g. did the user spend more time looking at side menu, header or main content?  This is because the screen is divided into static areas and the time spent looking at each area can be easily calculated.

Problem with Eye-Tracking: Unfortunately, this does not work with a map (or a virtual globe) and you want to keep track of the geographic location observed by the user.  In this situation, XY coordinates on screen recorded by the eye-tracker do not directly map onto Lat Long coordinates because the user can zoom, pan and tilt the map ‘camera’. 

Solution:  We have developed a solution entirely based on software developed for this project.  See example below:  
    
Heat maps showing density of eye fixations on a Google Earth map.  
Reading down, the screen shots represent zooming in.  
Red = High density, Blue = Low

Subjects were tested in a mock up of an educational situation.  They were shown (in a Google Earth tour) how to identify a special type of valley and then asked to find one in a given area.  The heat-maps show where on the surface of Google Earth the user was looking at during the experiment independent of zoom level/tilt/pan position. 

Heat Map Script: The heat-map script, developed by Patrick Wied, is particularly efficient in showing “the big picture” (top) but also shows dynamic rendering when the user zooms in.  The screen shots themselves are from a Google Map mashup with all the usual zoom and pan controls.

HowTo:  The solution we describe here only works with Google Earth as it requires the Google Earth API.  

Summary of the Process:
1)   During the experiment, the eye-tracker records each fixation in terms of X,Y tuple together with a very accurate timestamp (this is important).
2)   During the experiment, a custom script records the position of the Google Earth ‘camera’ which is producing the view  on screen.  It polls the Google Earth API every 200 milliseconds or so and every entry is timestamped.
3)   After the experiment, on a webpage using the Google Earth API we reproduce exactly the same view displayed during the exercise by feeding Google Earth the logs from  [2].
4)   Using the timestamp of each log entry, we look up the eye-tracking logs to find out if there was a fixation recorded at exactly that time.
5)   We then use the X,Y screen coordinates to poll Google Earth and transform those coordinates into latlongs. In effect we ‘cast’ a ray from a specific location on screen onto the virtual globe.
6)   Using the API we record the lat long from the end of the cast ray and put it into a database (see diagram below)
7)   This data is processed to render the heat-map.

There are obvious far more technical details that this but for the moment we thought we'd just get the idea out.

Problems with Eye-Tracking Maps:  There are a couple of inherent issues to do with eye-tracking virtual globe maps that have already occurred to us:

  • High Altitude Zooms:  At both high and low altitude the fixation is captured as a point, at a high zoom the user may be looking at a larger feature.  A circle polygon would better represent the fixation at altitude.
  • Tilt inaccuracy: In a situation where the user is highly tilted, the inherent inaccuracies of the eye-tracking kit get amplified - a small change in eye position can represent a large variation in distance on the ground. 
In the particular case study we've discussed today we don't think either of these are a particular issue but they need to borne in mind in other situations.


Wednesday, August 8, 2012

Simple or Complex Map Icons

Over at my other blog I've just posted a response to a Google IO talk.  In the second half of the post I discuss whether you should use simple symbol icons (e.g. circles) vs picture icons (a simplified icon showing a wolf) which is relevant to Google Earth.

Thursday, August 11, 2011

Navigation - Too much freedom?

I'm currently writing a paper about the use of GEarth Tours in education.  I thought I'd discuss one aspect that's come up: the problems of navigation in 3D software (thats Maps as well as GEarth as you effectively move through 3D space using pan and zoom).

The Problem: In GEarth you have 5 degrees of freedom:
  Altitude, Latitude, Longitude, Camera Pitch, Camera direction
Controlling these is complex and so causes problems - users can:
  • become lost in virtual space
  • get disorientated 
  • become confused as they fly through model walls (ie inside a building only designed to be seen from outside)
  • navigate around missing the views that the designer of a GEarth project wanted them to see.
As you may imagine any combination of these leads to the same result:  users become disheartened and leave to go and look at something else.

Similar Problems in other Software:  It isn't just GEarth - map systems, information spaces with pan and zoom functionality and Virtual Worlds all suffer from similar problems.  In some software its possible to fly straight into the ground with nothing visible at all which is when you get 'desert fog', users don't know where they are with no visual clues on screen to help them.

Solutions:  There are multiple solutions I've found in the literature, one is illustrated by Google Body:  Constraining freedoms of movement from 5 to 2.  When viewing the body your camera angle is fixed and you can only fly around a cylinder of fixed distance from the body (in fact it feels more like you are moving the body rather than your camear position but actually they add up to the same thing).  

GEarth Tours:  The solution readily available in GEarth is the GEarth tour, effectively you are constraining the user to 1 degree of freedom as within a tour they only have the ability to play or rewind  - nothing else.  This means that providing the tour is designed well we mitigate or solve all the problems I listed above.  

In education removing those issues comes at a cost:  users watching a tour are far more passive than if they are navigating around so we have to be careful to insert active tasks into tour.  For example, turning the tour off for a while and having students go and search for a landscape linked to the GEarth tour they've just viewed.  How to do this is the theory that we are investigating with our Google Research Award.

Thursday, August 4, 2011

Usability testing and Problems with Questionnaires

I came across this interesting presentation from Patrick Weber and Catherine Jones (amended to name both authors 11 August) at SOTM eu. He discusses usability issues with Open Street Maps editor using eye tracking and usability techniques. I only got the video to work by downloading it, the player didn't work.

Map Usability: What's great about this is that its a discussion about the usability of maps in the public sphere not a secret report for some company. IMHO there is a great need for much more of this work, we're woefully unaware of how to make interactive maps usable. It has lots in common with a current MSc project I'm supervising that I discussed last week looking at placemark clustering.

Simple Testing: Patrick discusses results from videoing users and eye tracking. These tools definitely help analyse and communicate the issues that arise from testing but you can still find out a lot without these tools via a technique is called Hallway testing (talk aloud procedure). It takes about half a day and needs no eye tracking or video recording.

Testing 'Doing' not Gathering Opinions: Hallway testing is pretty quick given the amount of information you get from them but its quicker still to gather feedback by questionnaires. Questionnaire feedback gives you some useful insights into your map system but it is by no way a complete picture. This was bought home to me this week in a reference I found about users searching for targets in overview* maps. The experiment tested search tasks with and without an overview map. Users were very positive about the value of overview maps but when the speed and accuracy of the searching were analysed using the overview it turned out that their performance didn't improve. Questionnaire data can be misleading, to really find out the truth you have to observe (and measure if you can) users trying to complete tasks with you map based tool.

*An overview is a small map in the corner of a web page showing the view from a higher altitude and usually marking the current view.

Wednesday, July 27, 2011

3 Crime Maps: Point collation

Quick update of the Placemark Clustering project: we'll be doing user tests using the uk police crime map later this summer (discussed below) comparing it to a chloropleth grid (translation = head map based on grid, I explain further here)

In thinking about this I've hunted down some examples and I thought it would be interesting to name check 3.

No Collation: The first map is Oakland Crime Spotting (bottom inset in figure) that is very similar to San Francisco Crime mapping, reviewed here. Unlike the other two maps it attempts no point collation at all, I image the authors would argue that they deal with the problem by providing sophisticated filtering tools to reduce the point density. However, it doesn't help if the user wants to get an overview picture of crime across the area the map covers.

Traditional Choropleth: Switching to the the UK, the Metropolitan Police (=London for non UK readers) offer a choropleth map based on wards and subwards (top left insert). I regard this as the traditional approach. Notably it doesn't show actual figures for postcodes, only sub wards - a sub ward is a collection of postcodes. My problem with this is that almost no one knows the boundaries of wards and sub wards so its a strange way to split the city up. (Aside: in my experience, Londoners tend to split London up based on tube stations)

Point Collation: The UK police offer a national map which uses point collation (top right insert). This is the main one we're planning to test as IMHO it isn't an effective way to visualise the data (related post). It offers a finer grain of data - you don't actually see the true location of the crime but it is collated down to the postcode level. In London, a postcode is roughly equal to a single street.

Also worthy of a mention although not a crime map is the Google Haiti Resource finder which uses a very similar point collation method of collating data points.

Wednesday, July 13, 2011

Cutting Edge 3D - no User Tests

Today I want to highlight the work of the Senseable Lab at MIT, from a brief review of their work I'd say they seem to specialise in the area of real time 3D visualization and sensor input.

Beautiful Design Ideas: From an artistic 'this is a work of art' point of view their ideas are novel, fun and highly engaging, see this TED talk for examples


I really relate to the water building, I hang out on the South Bank in London and there's a similar water sculpture there that is hugely popular (clip). Also, I'd LOVE to have some of those helicopter pixels in my lectures to illustrate geography concepts like earthquake waves to students.

Artistic 3D Visualizations of Singapore: This year the Sensable team have produced a project collecting real time data from Singapore and visualizing it. Here are some examples as a clip:


Looking from the angle of information communication there's lots to like:
  • Engaging animations. The graphics draw the viewer in to find out more, they're certainly engaging and artistically beautiful. I'm sure their exhibition at Singapore Art Museum was a sucess.
  • Elegant Time lines: They show time as a playhead moving against a timeline or against a bar chart illustrating relevant data. These elegant graphics are minimalist and communicate effectively without making the animation too busy visually. In a lot of ways they remind me of Tufte's sparklines.
  • 3D Data Visualized Well? I've previously praised their technique in the of visualising 3D data using altitude, color and opacity at the same time as a way of getting over the problems of 3D thematic maps.
Beautiful but Ineffective? However, I worry that beyond looking attractive, these visualisations fail to communicate the data effectively. Two example issues that occurred to me:
  • Double 3D = Busy: In the heat vs energy consumption visualisation I think trying to show 2 sets of 3D data at once with the top layer of data partly obscuring the bottom layer doesn't work well.
  • Where's the Rain?: In the rainfall taxi visualisation by having the rain plot in 3D above the ground its difficult to relate where its actually falling on the ground.
I raise these issues without any evidence that they are actually problems, the only way of doing that is to conduct users tests. On the research page of the Singapore project Sensable discuss technical innovations and I admit in a real time visualisation project these are significant and important. However, there is no mention of user tests, given the amount of time and money that has gone into producing these animations wouldn't it be a good idea to find out if they actually work?

Friday, June 17, 2011

Do Flashy Google Earth Tours have a Place?

Looking at the examples of GE tours out on the web I'm struck that they often use flashy attention grabbing effects but fail to communicate their content well, (an example discussed). However, watching this video made me pause and rethink


Intangible Value: In a very entertaining talk Rory advocates the importance of 'intangible value': its not anything real but its absolutely worth something. An example he doesn't discuss is the placebo effect, results show you can put a patient in an operating theatre, slice open their knee, wiggle some tools around inside achieving precisely nothing and the patient is likely to report a real reduction in knee pain after the un-operation. Amazing isn't it?

Chart Junk: I've always advocated the Edward Tufte approach to graphic communication, he regards anything that is not directly contributing to communication as 'Chart Junk' - anything that is there to make the tour look flash or just as decoration is getting in the way of the message and should be removed. Richard Mayer has empirical evidence showing that chart junk in educational animations (which are very similar to GE tours) has a negative effect on teaching efficiency which he calls the coherence principle.

Context is All: So is chart junk fluff that should be removed or does it add a professional feel and grab attention in a useful way? My view is that in formal education (taught classes in schools or Unis) producing intangible value should be low priority, any clever effects in GE tours fail to grab attention by the 2nd or 3rd lecture of a course. However, in an outreach context, particularly in a setting like a kiosk in a museum, a GE tour would be vying for attention against other exhibits so special effects represent intangible value that is worth having. These two contexts are extreme points on the end of a scale and there are all sorts of other contexts inbetween them for which decisions need to be made. The key question in making such design decisions is 'do I need to grab users attention?'.

Content First, Flash Presentation Second: Despite the context discussion above I would add that even in a context where flash presentation is important authors need to be careful that the message still gets through. Its no use grabbing someones attention if you fail to then do anything with the time they then give you. Juggling this need to both attract attention and also tell a good story is not easy but Hallway Testing is the solution.

My answer to the original question is 'Yes, but it depends on the context and where the answer is 'yes', be careful'.

Monday, June 6, 2011

Google Research Award – Identifying Learning Benefits of Google Earth Tours in Education

It is always nice to announce good news. Back in February, together with [Muki Haklay at UCL], I submitted an application to the Google’s Faculty Research Award program for a grant to investigate Google Earth Tours in education. We were successful in getting a grant worth $86,883 USD. The project builds on Muki's expertise in usability studies of geospatial technologies, including the use of eye tracking and other usability engineering techniques for GIS and my expertise in Google Earth tours and education, and longstanding interest in usability issues.
Job Offer: In this joint UCL/Southampton project, UCL will be lead partner and we will appoint a junior researcher for a year to develop run experiments that will help us in understanding of the effectiveness of Google Earth Tours in geographical learning, and we aim to come up with guidelines to their use. If you are interested, get in contact with Muki.
Our main contact at Google for the project is Ed Parsons. We were also helped by Tina Ornduff and Sean Askay who acted as referees for the proposal.

The core question that we want to address is “How can Google Earth Tours be used create an effective learning experience?”
So what do we plan to do? Previous research on Google Earth Tours (GETs) has shown them to be an effective visualization technique for teaching geographical concepts, yet their use in this way is essentially passive. Active learning is a successful educational approach where student activity is combined with instruction to enhance learning. In the proposal we suggest that there is great education value in combining the advantages of the rich visualization of GETs with student activities. Evaluating the effectiveness of this combination is the purpose of the project, and we plan to do this by creating educational materials that consist of GETs and activities and testing them against other versions of the materials using student tests, eye tracking and questionnaires as data gathering techniques.
We believe that by improving the techniques by which spatial data is visualized we are improving spatial information access overall.

Related Project: A nice aspect of the getting the project funded is that it works well with a project that is led by Claire Ellul and Kate Jones and funded by JISC. The G3 project, or “Bridging the Gaps between the GeoWeb and GIS is touching on similar aspects and we surely going to share knowledge with them.

For more background on Muki Haklay, see his blog. This is a joint post on both our blogs.