Wednesday, June 11, 2008

Tags and 20 Design Principles

I have added tags (or labels as blogger.com likes to call them) to my posts today grouping my posts here into:
  • Design Principles: Advice on how to construct maps in any virtual globe so not software specific.
  • HowTo: Specific advice how to do things in Google Earth
  • Experiments: Projects I've done worth discussing
  • GE Wish List: Things I would like to see in Google Earth
  • Project Review: Reviews of the work of others
You can access all the posts in a group using the links top right of this page.

Since Design Principles are the most numerous and important posts on this blog here's a complete list as of today:

3D Rears its Ugly Head Again
2005 - 2015: the Lost Decade of Neo-Geography?
Google Earth: Poster or Database?
Illustrating Scale
Map Design Improvements
Hallway Testing
Talk: Design in Google Earth
Think Old Newspapers
Tufte ideas on Google Earth Projects II
Tufte ideas on Google Earth Projects
Folders: The 3 x 4 x 5 rule
Folders as Picture Frames
Can't See the Wood for the Gerrymandering
Introductions II - By Video
What You're Gonna Tell 'Em - Introductions
3D Maps
Death to Acronyms
Introductions Help Your Users
Good Icon Design

Tuesday, June 3, 2008

Users Do Not Care

This is from the wonderfully named webpagesthatsuck.com talking about the principles of good web page design:

"Nobody cares about you or your site.

Really. What visitors care about is solving their problems. Now. Most people visit a web site to solve one or more of these four problems:

  1. They want/need information
  2. They want/need to make a purchase / donation.
  3. They want/need to be entertained.
  4. They want/need to be part of a community.

Too many organizations believe that a web site is about opening a new marketing channel or getting donations or to promote a brand or to increase company sales by 15%. No. It’s about solving your customers’ problems. Have I said that phrase enough?"

In this case what goes for the web, goes for the geo-web except that 'purchases' are rare and problem [4] isn't well developed in the geo-web yet (although Healthy Planet seems to be a good start).

A good illustration is my recent video tutorial, in it I used a series of videos embeded in Google Earth, users were not restricted to an A to Z navigation system through the videos but it was designed with this in mind. Lovely Youtube hosted them for me and kept track of the hits. This graph shows the length in seconds of each video by title

As you can see the total length of the set is less that 13 minutes long and I would expect you could complete the whole tutorial in 1/2 to 3/4 of an hour. So, having gone to the bother of downloading the file and booting up Google Earth, how did people fare going through the material?


Graph of Video Hits vs Position in Tutorial.
Purple bars are data (black numbers show data values), transparent bars show a 'half life' curve where the number of users progressing to the next video is halved each time. Numbers here relate to the order of videos and refer to the same videos as in the first graph.

The graph shows pretty well that users have almost no attention span on the geo-web, fully 7/8 of them had given up without watching more than 3 minutes video (only 76 of the 651 got to video 4) which translates to total time spent on the tutorial of probably less that 10 minutes . I don't think all these users are the kind of person who cannot avoid changing TV channel every 30 seconds, no, I think they found that my tutorial did not 'solve their problems' so they clicked onto something new without completing the tutorial.

This is why design issues matter; even a small glitch can dramatically reduce the total user time spent on your Google Earth Project.

Further Analysis of the Results: The graph varies quite widely from a half life curve in the lower reaches of the tutorial. I put this down to a number of factors:
  1. Users coming across my tutorial not via Google Earth but via Youtube in which case I presume they dived into the topic area they were most interested in, wondered what the damn thing was about (the clips don't make sense on their own) and navigated away. They wouldn't be affected by the order of videos in GE so would contribute hits randomly across the set.
  2. Navigating to what interests them instead of what is next. An example is video 6 which is about overlays, from my first batch of videos I know this is a popular topic for users to access.
  3. I ran a tutorial with 40 undergraduate students using the videos, I imagine the possibility of the material being on the exam drove my students through more of the tutorial than the average member of the public would have done which would have skewed the results.

Thursday, May 29, 2008

Tour Control now Possible. Yay!

First a question: At the grand old age of 39 am I still allowed to use "Yay"? :)

Anyway, way back I suggested that the lack of control of tour was a problem with tGoogle Earth and recording a video of a tour was a solution. Here's an example:


Well, the release of GE lite in a browser means that good tour control is now possible which is what excites Dan Catt too. Instead of the above tour being an embedded video I can embed a Google Earth window, fly people through a tour of a Google Earth based project and then leave them to explore in more detail on their own in the same window. Great potential for all sorts of projects.

Now I just have to remember all the javascript I've forgotten since I built this flash resource.

Wednesday, May 28, 2008

Rising Block HowTo

Back before Xmas I wrote about Declan de Paor and his work on rising blocks or 'BumpOuts' as he calls them. You put an image of a geological cross section or other sub surface data on a block, using the time slider to drag a the block out of Google Earth. This gives users a sense of location, scale and the idea that the cross section you are using is actually a cross section (often students miss even that point).


Rising Block in action. Sorry about the low quality video.

I've worked out how to do them and here is a howto:

  1. Using Google Earth select the location where you want to put your block. Fly vertically over the area and using 'Prnt Scrn' or equivalent capture an image of the area.
  2. Trim the image you collected in (1) to the exact rectangle on the ground you want using your favourite image processing tool. I use fireworks but GIMP is free.
  3. Also using your image software process the image to go on the side of the block if needs be, save both images as types that sketchup can read (e.g. .jpg or .png)
  4. Using Sketchup draw a simple block not bigger than a house. Sketchup has lots of good tutorials so I won't go into details.
  5. Using File > Import, import both images into sketchup and drag them onto your block and position. This is pretty intuiative. The screen shot goes on top and the section image goes on whichever side you wish. Using the push/pull tool resize your block so your images fit exactly on the faces you have put them.
  6. Save your block as a .skp file to be sure.
  7. Link your block with its location in Google Earth and import
  8. Now find the model in the places folder (its inside the folders and has a 3D box icon)
  9. Right click and select properties, when the green square appears drag it and resize it until your block is the correct size and in the correct position. When you're happy click OK.
  10. Right click the model icon in the places column and select 'save as', save it somewhere sensible as a .kmz file.
  11. Right click the model icon again and select 'copy'.
  12. Open my 'blocker' XL work book, clear the 'Scratch Sheet' (the data that is there shows you what you should get). Select cell A1, right click > paste. You should see a load of text appear. Don't worry that you don't understand the code, you don't need to.
  13. Moving to the 'Process' sheet you have to replace the white cells here with data from the scratch sheet. You need to find the tags within the scratch sheet for <longitude>, <latitude>, <x>, <y>, <z> and <href> and copy them to the relevant cells on the process sheet. To do this Ctrl F for find is your friend. I've shown you exactly how the cells in column C should look in column E of the Process sheet.
  14. Enter the 'Start Depth of Block', in C4, this is the depth the first block will be buried to and should represent the height of your block. Note its a negative value!
  15. Once you have copied in values for all the white squares you're ready to go. Select cell A1 on the 'Out' sheet and right click > copy.
  16. Right click on the 'My Places' icon at the top of the Places column, select paste.
  17. Click on the 'Time Block' icon that appears and your blocks should animate by using the timeline.
Phew! Its a pretty long process so not for the faint of heart. However, as with all processes like this it gets quicker once you've been through it once. The result is worth the effort especially when you combine blocks - we are looking at animating ice core data and lake sediment data for our geography students to use in practicals.

I think the XL file should work but be wary, its not user tested yet.

I'll put an example KMZ file up tomorrow, I really need to slim it down in size before you all start grabbing it.

Later: I've just edited the text as point 13 wasn't appearing properly

Later Still: Not the one in the video but one of lake temperature with depth

Thursday, May 22, 2008

TMapper: Thematic Mapping Tool

Executive Summary: We have produced an early version of 'TMapper', a tool that will allow the generation of thematic maps with Google Earth. It is designed for humanitarian work so it has the following characteristics:
- Does not require constant web access
- Simple to use, understanding KML not necessary
- Works with any user generated set of polygons and palette
- Automatically produces a key and the processed polygons can be queried in the main Google Earth window.
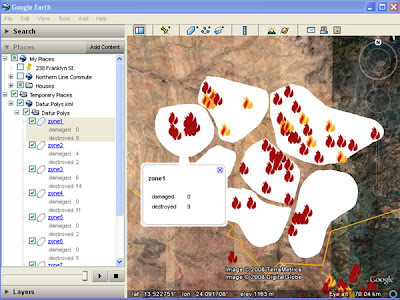
Raw Data: This is a screenshot of user generated polygons* with a simple html table of data in each polygon. In this case the data are the number of damaged and destroyed villages (from the Dafur Layer) in each polygon. Note that you cannot click the polygon to get the description like a placemark, the polygon description has to be accessed through the places column.
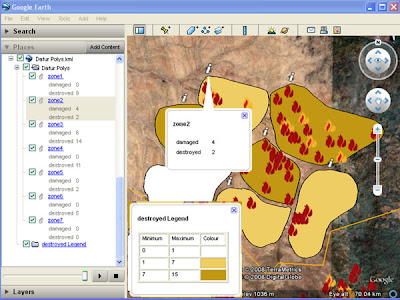

Processed data: After using the tool, the polygons are converted to a color coded thematic map, a key is automatically generated and a 'i' placemark produced which can be queried from the main screen to show the data. (note for simplicity the legend has been copied in afterwards, in real use the legend appears center screen and legend and pop up balloon cannot be visible at the same time)

Relationship to GIS: The idea for this tool came from discussions with Nigel Woof of MapAction and my boss Dave Martin. In GIS a lot of data is stored as attribute tables attached to Polygons, e.g. a table of the number of male/female/sick refugees is linked to a series of polygons showing refugee camps. This is a useful format but not possible in Google Earth. After discussions with Ducan Hornby of GeoData (who has done all the coding) we decided to have a go at producing a tool that could enable this.

Scrappy Maps: The original idea was to allow an Aid worker in the field to produce thematic scrappy maps , this means that TMapper must be usable in areas of poor web connection and should be simple to operate. E.g. a worker helping in the China earthquake disaster can quickly digitize the borders of a series of reservoirs and attach data such as distance from earthquake epicenter and volume of water.
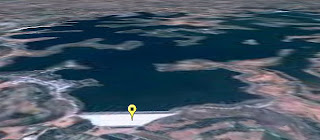
View of a Dam and resevoir that could be damaged due to the recent Chinese Earthquake, taken from Mark Mulligan's Dam GeoWiki via Ogleearth

Two separate thematic maps can be produced (one for volume one for distance) using our tool and compared by using the layers control in the places column.

Related Work: Bjørn Sandvik has produced some thematic maps in Google Earth but he uses php which requires web access or a fiddly PC based server. Kaitlin Duck Sherwood has produced Mapeteria which also produces thematic maps but that requires a web connection and only works for predefined polygon sets.

.NET and KML format: Part of the justification for doing this was that Duncan wanted to explore working with .NET VB so our tool is written in this language. After defining a palette, the tool writes a series of polygon styles that color the fill of the polygons. Individual polygons are linked to the styles depending on the value of the variable in their descriptions. The tool produces the 'i' placemark via multigeometry (another multigeometry example) . Finally, the tool automatically produces a KML folder with a simple html table in the description which has a key in it.

Demo: A demo of the tool in action
(note big download)

Next Steps: We would like to release the tool but we are having installation issues as the program appears to be fussy about the version of .NET installed so these need to be cleared before release. We would be grateful of feedback from the developer community about choice of alternative language to produce this in and the Aid community in terms of its applications. Further work would see us produce a key via screen overlay, get the 'i' to plot itself just inside the polygon rather than outside and allow palettes to be saved for reuse.

*I just made them up, they could be river basins or administrative districts.

Monday, May 12, 2008

2005 - 2015: the Lost Decade of Neo-Geography?

Google Earth can be thought of as a geo-browser , it shares a lot of characteristics with a web browser but is based on a map paradigm rather than a book paradigm. If you are prepared to accept this comparison then its sensible to wonder if the the usability development of the geo-web will follow that of the web. I've been reading a lot of Jakob Nielsen
material recently, he's a web usability expert and has talked about the history of the web:
We [usability experts] have now harvested most of the low-hanging fruit from the truly horrible websites that dominated the lost decade of Web usability (approximately 1993–2003). In those early years, Web design was abominable...

Clarity Point: we're discussing the usability of user created content here, not the usability of Google Earth itself, that's another matter and is beyond the user's control.


Abominable Web Design (follow the link to see it properly)
found via www.webpagesthatsuck.com

I think there are some truly horrible Google Earth projects out there just as there were terrible web sites in the early years of the lost decade. It's true that there is less flexibility to create awfulness in Google Earth than in a browser, for example with Google Earth you can't create your own navigation bar (or at least its very difficult to do). However, there are many published google earth projects where little or no thought has gone into design: introductions are long winded, icons don't stand out when clumped together, thick lines in intense colors have been used when thin neutral lines would have been better and so on. IMHO the usability quality of the geo-web so far is following that of the web pretty much to the letter.

In answer to this point a common reply is: 'we're just experimenting with a new format with Google Earth and Google Maps, worrying about design would hamper our innovation'. Its a fair point, I think innovation is important. But Jakob goes on to make another point that is apt, it's about conversion rate, which is the number of web site visits that are converted to actual sales for a commercial web site:
At the height of the first dot-com bubble, a common conversion rate was 1%. Today, 2% is a common conversion rate.
An increase of 1% to 2% doesn't sound that convincing, however, it represents an increase of 100% in sales. At present there aren't many organizations out there selling via Google Earth but there are many organizations who are using it as an outreach tool or a way to access donations, I suspect organizations who haven't considered design could increase the effectiveness of their work ( measured in whatever way they choose) by tens of percent if they spent more time improving the design of their materials.

Google Earth has been out for 3 years, I hope it doesn't take another 7 until people wake up and smell the coffee.

Thursday, May 8, 2008

Flow Chart version 2

Kirk Kittell pointed out that I hadn't put links on the flow chart and that it would really help. Mea Culpa, he's right, I was being lazy as I was just about to go on holiday.

New Improved Flow Chart