Wednesday, February 23, 2011

Geography's Importance in Schools: National Curriculum

In the UK the government has called for a consultation about Geography in the national curriculum. Here's part of my response:

Question: Why should Geography be maintained with a national curriculum (i.e. the government defines what schools teach rather than just advising them what to do):
Geography is a vital area for schools to cover in the future both for the safety of the environment we live in and also our economic future for two main reasons:
1] Climate change is the central issue that our country will be facing in the future, whether or not it is front and centre of government policy right now. We need citizens of this country to have as much of an understanding of this as possible to be able to engage in the debate, both the science and the human sides of the discussion. .
2] There is an explosion in the availabilty and visualisation of spatial data, maps and map related graphics occurring on the web at present and the UK is at the forefront of this work with economic benefits for the UK. For evidence of this you only have to view Tim Berners-Lee's recent presentation 6 minute presentation to TED on open data:


In it he uses maps as visualisation tools no less than 8 times for 9 mini case studies of open data.

In 'any other points you wish to make':
I am particularly concerned about a specialist part of the Geography curriculum which forms my research interests. The use of GIS (Geographical Information Systems) at school level has appeared in the school curriculum without a proper understanding of the complexities, uses and value of this topic area. The curriculum mis-informs them how to implement GIS in their teaching. It is my opinion that at school level school students should be using ICT to visualise map data e.g. view a map showing the voting patterns across the UK and to see the general pattern that Conservatives do well in the country, Labour does well in cities. Then zooming closer in, eg. on London, to see that it isn't all labour voters. Teachers are confused thinking that they need to use more than ICT visualisation, e.g. proper GIS analysis of geographical data, e.g. to get the computer to draw zones around motorways and relate that to respiratory problems in the area. Analysis like this is too complex for school students to tackle and, as well as this teaching problem, it encourages schools to waste money on buying GIS packages that are more powerful than necessary whereas free software, such as Google Earth is perfectly satisfactory for visualising geographical data and thus teaching geography in schools.

Tuesday, February 22, 2011

Google Earth Presentation II

Last weeks tutorial on creating presentations was complex so I produced an XL spreadsheet to simplify things. The instructions to use this are:

How To Make Your own Presentation:
  1. You will need a Google Account so you can create Google docs and to be able to produce a Presentation in docs.
  2. In Google Docs create your presentation (relevant help).
  3. Click Share (top right) > Publish/Embed then copy the link that appears under the 'Your document is viewable at'. Paste this text (beginnin "https://..." into cell C2 of this spreadsheet. Select the big cell with lots of text below it and right click > Copy.
  4. Back in GEarth, select 'temporary places' in the places column and right click > Paste. Click on the cross to the left of 'KmlFile' to expand your list. You've just created a set of 10 placemarks with links to your presentation. If your presentation is less than 10 slides long you can delete the unnecessary placemarks.
  5. Choose your starting position, generally you want to start with a high view covering all the locations if that's possible. Select the ''Presentation" folder and create a tour flying from here to your first location (tour creation howto). Call it something sensible, e.g. "tour 1"
  6. Drag your Tour up the list until it is above the "**Click for Slide1**" text
  7. You can now test your presentation, double click the tour then when its complete, click the line "**Click for Slide1" and you should see your presentation slide in.
  8. Repeat steps 5 and 6 creating lots of tours that you drag inbetween the slide placemarks.
  9. Select the KmlFile icon and Right click > save as to save the presentation.

Monday, February 14, 2011

Google Earth Presentation

Edit 16/2/11: Corrected broken link to presentation example

If you're like me you make presentations using PowerPoint and GEarth and spend your time flicking between the two. This isn't very slick and I think a combination of the two would be very powerful. It turns out it isn't difficult to do taking advantage of Google Docs Presentations and the integrated web browser in GEarth. Download this presentation example.

To run the presentation:
  1. Click the link that starts "https"; the lower of the 2 lines to the right of the slide 1 in the Places Column.*
  2. The first presentation slide opens in the browser (it may delay on the first slide). Click the right arrow that appears bottom left of the screen repeatedly to make the presentation build up . Continue until the text '<- Back' appears bottom right.
  3. Now double click the "High to London" tour in the Places column. GEarth flies to London.
  4. Repeat [1] for slide 2
  5. Repeat [2] for slide 2
  6. Repeat [3] but click "London to Shropshire" tour instead
  7. Repeat [1] for slide 3
*If you click the line 'slide 2' you will open a balloon rather than opening the browser directly. If you click the tick box icon to the right the tick will disappear but nothing else will appear to happen at all.

It's a little fiddly but better than flicking between PowerPoint and GEarth.

How To Make Your own Presentation:

**NB: For simpler process via a spreadsheet see this later post
  1. You will need a Google Account so you can create Google docs and to be able to produce a Presentation in docs.
  2. I used incremental reveal to make the slide develop step by step but you don't have to. You may want to make the last increment of each slide read 'next tour' as I did so that you know when the end of the slide is reached, otherwise you may keep clicking and go onto the next slide at the wrong time.
  3. In Google Docs Produce your presentation (relevant help).
  4. In GEarth Produce a project folder (click 'temporary places' in the places column so it gets a blue background then right click > Add > Folder).
  5. Choose your starting position, generally you want to start with a high view covering all the locations if that's possible. Create a tour flying from here to your first location (tour creation howto). Call it something sensible, e.g. "tour 1"
  6. Now create a placemark, in the dialogue box that opens, click the icon button in the top right corner. In the new dialogue that opens choose 'no icon' at the bottom. This means no icon appears in the main screen, this placemark will just carry the link to the presentation. Click 'OK' once to get back to the main 'Edit Placemark' dialogue but don't close it yet.
  7. Open your Google Docs presentation in a browser. Click Share (top right) > Publish/Embed then copy the link that appears under the 'Your document is viewable at'. Paste this text into the big description box of the placemark dialogue in Google Earth.
  8. At the end of the text add the string "&skipauth=true&start=0". There must be no spaces and it should end up looking like this: "https://docs.google.com/present/view?id=dg7jd85c_27c3mm9bf7&skipauth=true&start=0" (i.e. everything will be the same except the text between 'id=' and '&skipauth=...' and it should all be on one line in GEarth).
  9. The string of text you added tells the browser to open the presentation at slide zero. Confusingly, to the browser slides are numbered "0,1,2..." rather than "1,2,3..." hence we start at slide 0.
  10. Name your placemark "Slide 1" Click OK in the dialogue box and you should see a placemark appear in the places column. clicking the link should open the first slide in the browser window.
  11. Record a tour from the current location to your next location.
  12. Select Slide 1 placemark in places column, Right Click > Copy then Right Click > Paste. Drag the new placemark down the places column to the correct location. Right click > properties and change the '0' on the end of the string in the description box to a '1'. Click OK. If you now select the link in this new placemark you should see the next slide of your presentation.
  13. Repeat steps [11] and [12] as many times as necessary. I would advise you to put in an intermediate high point between 2 locations if they are both low as I did between London and Shropshire as this allows users to see where they've been and where they're going.
  14. Now make sure all placemarks and tours are in the folder you created in step [4], drag them in if necessary. Select that folder and Right click > save as to save the presentation.
Notes:
  • No Offline: This technique can't be used offline as the presentation tool only works when you're online. If you won't get wifi where you're going the only slick alternative is to pre-record movie clips of tours in Google Earth and embed those in your PowerPoint. Its trustworthy but takes a lot of time.
  • Videos: You can embed youtube clips and similar multimedia in the presentation which would be useful.
  • Markers: If you wish to mark locations on the ground you can add a 'markers' sub folder as I have and put in placemarks, polygons as you wish.
I don't know how much development work it would be but this would obviously be much slicker and easier if you could record the opening of the browser and the URL it calls in tours and control it with a universal 'Next/Previous' pair of buttons that worked both GEarth and the presentation.


Friday, February 4, 2011

Dreamweaver for Google Earth

I noticed that Declan wrote up an idea we kicked around in September (see 'September' on the DigitalPlanet pages), so I thought it deserved a post. I referred to it then as 'Dreamweaver for KML.

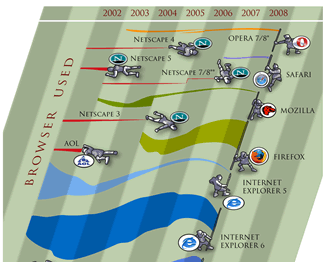
Image courtesy of favbrowser. A bit out of date but still interesting.

Browser History: In 1997 Netscape adds a feature to its Netscape communicator browser that allowed for WYSIWYG simple production of html web pages. To put that in context you have to recall that this was the late days of the browser wars between Microsoft and Netscape. Then in March 1998 Macromedia release dreamweaver 1, this allowed web pages to be created in WYSIWYG or code views and produced short cuts that produced elegant html. It was also extensible so you could write a 'macro' to produce custom HTML. Developers loved it.

Geo-Browser History: My point is that if you regard GEarth as a geo-browser then the history is similar. Today in GEarth you can create simple maps and tours just like in Netscape communicator you could create simple web pages. However, a lot of sophisticated features such as time, region control, pauses in tours need to be hand coded into the KML. There are a few tools out there that allow you to produce KML without hand coding such as the spreadsheet mapper, my spreadsheet for adding loops and a tool for adding screen overlays but these are all limited in scope.

Tool Description: An obvious improvement would be 'Dreamweaver for Google Earth', where all this functionality was combined into one specialist KML producing program just as dreamweaver was a specialist HTML producing program. It would need to be:
  • WYSIWYG, ie be able to write code directly or using wizards and then see the result in an instance of the GE API
  • Extensible allowing you to write an extension that produced your favourite snippet of KML structure.
  • Elegant, highly usable and producing well formed KML code
So what should its wizards allow you to produce? My list would be:
  • Time control
  • Screen Overlays
  • Functionality producing usable maps e.g. color palettes that avoid color blindness issues
  • Simple sketchup models such as a photo billboard
  • Region controls
as well as enhancements to editing tools that are already available in GEarth such as better polygon digitising controls.

Flash Editor for Google Earth? So why haven't I mentioned tours yet? Well, I think the analogy here is with FutureSplash Animator (later 'Flash') released by Macromedia in 1996 which was a timeline based tool for producing animations on the web. It pre-dated Macromedia Dreamweaver and was kept separate. To me, it makes sense that a Google Earth tour is an animation so it needs a separate animation editing tool that is timeline based, I explain in more detail here (although I discuss it by comparison Captivate, another timeline based tool).

So Why aren't you Building these programs then? because if I did, and it was a sucess, a certain company ending with 'Oogle' and beginning with 'G' would bring out a rival and completely blow me out of the water. Instead this is a lazy web request.

Thursday, January 20, 2011

Flood Simulation HowTo

EDIT 26 Jan 11: changed relative to ground to absolute, thanks to Google Earth Blog

In his novel 'Book of Dave', Will Self imagines a world in the future where sea levels have risen over a 100m.


This destroys civilization as we know it but leaves London skyscrapers still standing half underwater in the sea - the remaining humans who live on 'Ham' (an island created from the rising sea surrounding the high ground of Hampstead Heath, London) climb one of these which they call 'Central Stack' to capture seagulls. As the book has a map of Ham in the front I played around in Google Earth to see how accurate the boundary of the island actually was, as it happens, Will's imaginary island is what would really occur if sea level rose that far.

I realised the technique I used (one a teacher pointed out to me at a training session a while back) could be used in a lesson to visualize rising sea levels or ancient ice sheets. If you draw a polygon and give it an altitude that is about ground level the sheet created will disappear below the ground where the land is higher but be visible where the land is lower. Here's how to create a series of these sheets in a folder so you can show a sequence of increasing sea levels :
  1. Click the Temporary Places folder in the Places column (it will get a background) then right click > Add > Folder. Add a name in the dialogue box and tick the 'Show contents as options' box. You'll see why in a moment.
  2. Navigate to a location you want to 'flood' in the main screen. Right click the folder you've just created > Add > Polygon. Move the dialogue screen that opened out of the way (I move it to the bottom of the screen) and click the 4 corners of a square. Make it less than 10 miles across otherwise wierd things happen to the layer because of the curvature of the earth (I think, see note below)
  3. Drag the dialogue box back into view and under the 'Style, Color' using the controls titled 'Area' select an appropriate color for the square (blue for sea level rise, white for an ice sheet?) also select an opacity of 30% or so.
  4. Under the Altitude tab choose an altitude of 100m and then select 'Relative to Ground' 'Absolute' in the pull down menu. This will raise your colored square 100m above the ground.
  5. Name your square something sensible but with a '100' in it (e.g. "London 100m") then click OK.
  6. Now right click the element you created in the Places column and select copy. Right click the copy >Properties > Altitude and change the altitude to 200m. Change the name to replace 100 with 200 and click OK.
  7. You should now have 2 sheets, one at 100m altitude and one at 200m. Clicking in the circles turns one on and the other one off automatically.
  8. Experiment with altitudes that works for your chosen location, copy and paste more sheets if necessary by repeating step [6] - within the folder you created only one sheet will be visible at any one time.
  9. Right click the folder and select 'Save As' to save and send to someone else.
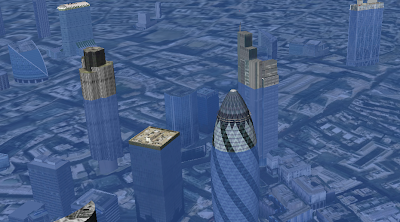
3D Buildings: It's a lot of fun to turn on the 3D buildings layer whilst you have sheets visible in the layers column, as in the screeen shot the layers will show how deep buildings would be sunk in the sea - not sure if any of those in the screen shot are Central Stack.

Absolute Heights: Experimenting with the levels, the sheet behaves oddly, it doesn't meet the land at the height you would expect. I'm not sure why this is but it may do with the curvature of the earth (in the middle of a big square the earth will protude through a level sheet even though there is no topography). If anyone has a definitive answer I'd like to know.

Surface Flicker: If you zoom into the layers from a distance you may see line of where land meets sheet flicker and change. This is because GEarth creates the view of the earth you see by taking the satellite images and draping them over a set of 'posts' it builds rather like a marquee tent. If you view the ground from a higher altitude GEarth uses fewer posts so the surface changes as you zoom in and out. There is a way around this but its fiddly, I'll post about it if anyone's interested.

Friday, January 14, 2011

Penrose Geoscience Education and Research Conference

So I've had some time to get over my jet lag and reflect on this conference held at the Googleplex last week, the conference website is now public.

I had a great time, the trouble with being an earth scientist/KML developer/educational expert as I am is that I never quite fit at any conferences I go to. This one was an exception, as an example: on the bus on the field day I had a conversation with the colleague sitting next to me about extractind DEM data from Google Earth, then switched to talking to the colleague behind me about the value of project based teaching in US schools. Then we hopped out of the bus and went and looked at rocks. Ace!

So cherry picking things that stood out for me:

Effective use of 3D: Barbara Tewksbury described how she used some stunning geological examples in arid regions to teach the introductory geology concepts strike and dip. (abstract here)

Avatars in GEarth: Steve Wild and Mladen Dordevic described the latest progress on getting communicating avatars into GEarth for the purpose of group teaching geology (disclosure: I'm a consultant to this project). Using JavaScript they can have avatars communicating and sharing locations with each other, its early days but I heard a lot of enthusiasm for the idea at the conference (no link yet but I think watch this space for news and to see other parts of the project)

Paper works so use Paper: In discussing getting students to understand the concept of the mid Atlantic ridge Heather Almquist described an activity where instead of getting students to use the new Cross section facility she got them instead to read off results and plot them on a piece of paper, 'they don't understand the concept of a cross section if you don't' (abstract). I've always advocated appropriate use of technology and this seemed a great example of not overusing technology.

Powers of 10: I've heard it said that an inspiration for Google Earth was the powers of 10 film


by Eames and Eames. I remember being mesmerised by it as a kid (blog post tribute), Ron Schott gave a keynote describing his use of Gigapan photography. I like gigapans but I was more impressed by a sequence where Ron presented a series of gigapan views each a subsection of the one before. It reminded me of the powers of 10 film and sparked an idea I might apply sometime in the future.

GEarth API Twins: Another of Ron's smart ideas was to put two instances of a GEarth API of the same view next to each other. This can be used to match geological strata as he showed or to render an overview of a region while the user flies into the second twin which he didn't. I can't find an example of showing geology but for an idea of what a 'twin' is this uses twins to show the antipodes of any location.

Into the Googleplex: Finally, it was fascinating to visit the Googleplex having heard so much about it (video tour). I expected to see the fun stuff but what hit you was the youth of almost everyone there, hardly a grey head to be seen and the perks of being a googler: fantastic free food, wifi enabled luxury buses taking you home and (the visual memory that is strongest for me) an infinity pool big enough for 2 googlers looked after by an attentive life guard under an umbrella in the early evening of a January day.

Friday, January 7, 2011

Penrose Conference Days 1 and 2

So I meant to blog about the conference as I went along but I've found myself busy meeting up with lots of contacts and writing/editing my talk so I haven't found the time.

Day 1 Personal Highlights:
Declan De Paor and John Bailey welcomed us all, they and the rest of the organising team have put a ton of work into organising the event - John reckons he's written an average of 3 emails a day over the last year just about the conference.

Mano Marks talked about lots of new Geo things, the bit that most interested me was fusion tables and maps, I confess I've never understood what they're about but the key points to me about them are:
  1. Cloud based and free
  2. Built to handle lots of data
  3. Limited spatial functionality now but more being built in the future
  4. Can import shape files and export KML
  5. You can build a web based interface with them so you could build a custom web page to query a given data set and visualize results on a map
Thanks to Christiaan Adams for helping explain them to me too.

Tina Ornduff described Google's approach to education. I think they are getting much more serious about it which is a welcome development.

Barb Tewksbury described using geological outcrops in arid countries to teach geological 3D interpretation, very smart. Paul Karabinos outlined using sketchup to teach 3D geology too.

Day 2 Personal Highlights:
I did the keynote on 'User First all else follows'. I've put slides and links on prezi but they won't make much sense if you weren't there as I haven't posted the videos and its designed for people who saw the talk. People have been very kind about what I was saying after the talk.

John Bailey and Sean Askey talked about creating tours, I was persuaded that tours generated from lines can be worth trying out.

Unfortunately I missed out on a number of talks and posters on day 2 as I was talking to colleagues about current/future projects.