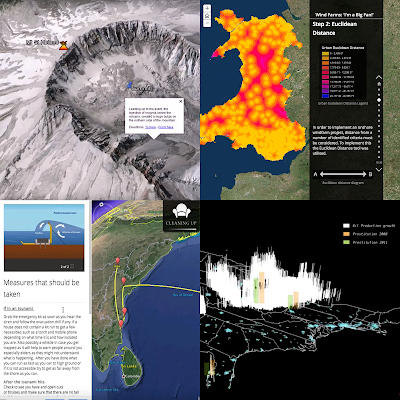
 |
| Screenshots from student produced ATs I've found on the web |
What is an Atlas Tour? So I’ve been writing some papers over the summer about ‘Atlas Tours’ (ATs) by which I mean a series of maps that tell a narrative. An example well known in the UK residents is the BBC TV weather forecast,
which is made up of animated time maps, camera motions through virtual space and a narrative delivered by a presenter. In UK outreach events I used to run teaching geography, this was the ‘map’ that people said they looked at most often.
ATs encourage users to watch: A great example of how useful ATs are is from National Geographic who produced this site about tracking the illegal trade in ivory across Africa . The web logs of this resource show that atlas tours encourage people to engage more with content than other non-narrative, interactive maps (Kaitlin Yarnall Presentation at 18.40 minutes).
Easy enough for students to do: The cool thing is that the technology (and I'm thinking Esri Story Maps and Google Earth Tour Builder here) has made it easier for students and other non-specialists to produce ATs almost as sophisticated as the Ivory trade example. As a result a number of assignments have been set asking students to produce ATs, a good example is the PSU and Esri MOOC which asked students to produce a map based story as a final project, many chose to produce ATs via Esri Story Maps (Anthony Robinson and Colleagues paper (2015) )
Other Examples of students’ ATs on the web include:
- The Mt St Helens 1980 eruption - one of my students!
- Fuzzy logic applied to wind farm location
- Guarani aquifer depletion
- Oil fields and prostitution
One of the papers promotes ATs as a good assignment to set students, watch this space for more!
No comments:
Post a Comment