Thursday, September 9, 2010

3D Geology Models

I'm in Norfolk, Virginia working with Declan de Paor and team at Old Dominion University this week. I've already had a fascinating time looking at their latest work (see an old post for more details of the type of thing Declan does). An example is a model of the earth below Iceland, screen shot below.


The great thing about this project is that unlike most TEL (Technology Enhanced Learning) projects I've been involved in, the team here have a lot of technical examples working already and we're just starting! A lot of TEL projects start with a teaching idea without knowing how to produce it technically which means that little or no time is left to find out if the learning technology works as the team's time is absorbed in solving technical problems. So I think this project is really going to produce some excellent materials and push forward the use of Google Earth in education.

Google Earth API Use: One thing Declan's team are doing that I think is really clever is that they're using the GEarth API to reduce complication. Instead of having lots of controls like the compass control and layers panel in the GEarth client, they use the GEarth API showing only the controls that they need which simplifies the tool for students. Unfortunately they haven't published any examples yet but I'll point them out when they appear.

Wednesday, September 1, 2010

Google Earth for Scale: Colossus of Endlesham Road

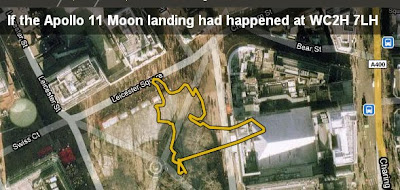
I really like howbigreally.com, a project by the BBC using google maps to illustrate the scale of things e.g. it puts the Apollo 11 moon walk into your local park.


The idea of sticking the statue of liberty or Nelson's column into a figure to show scale is nothing new and is something I do myself in Google Earth, e.g. UK outline vs Gulf oil spill . What's clever about howbigreally is the use of Google maps as a backdrop and some excellent choices of topics to illustrate.

Their examples are all of lengths and areas though, to illustrate the size of the statue of Colossus they show the statue's footprints. It made me think, this would work with 3D topics such as giant statues if it was done in Google Earth with sketchup models. I experimented and the rough and ready result is below:


The (Large 2 Mb) Google Earth file: Colussus

Putting a model in Google Earth to scale wasn't difficult but around where I live, the buildings aren't modelled in 3D so I combined a screenshot of the model in Google Earth with streetview imagery to show the statue in place.


HowTo:
1] Look up Colussus in the sketchup warehouse, (the one I use is courtesy of Goldie). If the model isn't in KMZ format already, load it into sketchup then export to Google Earth (HowTo). Obviously you can put any sketchup model in place, not just Colussus.

2] Once in Google Earth find the size of your model (I looked up Colussus on wikipedia), in this case I knew his height so I produced a placemark and gave it an altitude (in the edit Placemark box > Altitude tab > Relative to Ground (pull down menu), enter height in Altitude box and tick extend to ground box).

3] Right click the model in the places column and click properties. Move the camera until its looking down on the model, you can drag the green box corners, sides and central cross which will alter the size and position of the model. Do so until it matches the height of your placemark and is in the right position.

4] In the properties as above use the green diamond to rotate the model to the correct position.

Automating: Just as howbigreally automates areas and lengths against Google Maps, it would be possible to automate the position of a model like this in Google Earth and produce an automatic tour around it too.


Thursday, August 26, 2010

Personal Website Update

Following yesterday's post, I thought I should get started updating my personal website. It was surprisingly quick and easy, I'm all done!

I've added items to the publication, project, lesson plan and tutorial sections that weren't listed before (if you've followed this blog, I've discussed most of them here). I've also fixed broken links and generally had a good old tidy up. Very satisfying!

Wednesday, August 25, 2010

Current Projects: Haiti, Tours, Education and China

This summer has been very busy so I haven't got around to updating projects on my personal web pages. There are a number of projects that I'm working on at the moment that aren't listed and deserve a mention:

Haiti Maps Usability: I am supervising Luke Caley an MSc project student looking at usability of maps in the Haiti earthquake disaster, Luke is talking to people who where there at the early stages of the disaster investigating how maps and mapping were used in the field. There is a related area about the usability of crowd sourced map systems that is fascinating but unfortunately beyond the scope of this study.

Our theory is that Aid workers are a group for whom map usability is critical: when you publish a map on the web user's are only ever a click away from watching cats falling off sofas on YouTube. In an emergency situation the attention of aid workers is even worse - trying to figure out your map is time they could be using to pull people out from under collapsed buildings. So far the interviews seem to be showing that our theory is basically correct. Lots of organisations are generously giving time to helping us, for example ImageCat and MapAction. Final results are due in this autumn.

Google Earth Tour Research: Research is continuing into defining best practices for using tours in virtual globes (see 58:12 into this video for my talk on earlier work). Our results will apply to any virtual globe but for this study we've chosen to use Google Earth. Our main areas of investigation are into seeing how speed of flight and path geometry in tours affect the user's ability to track where they are within Google Earth. The video clip below illustrates the effect tour path has on user understanding, keeping track of where you are is easier on the outbound flight than on the return inbound leg:


User testing on students is planned for September and the results will be used in teaching materials. These materials will support students who will produce their own tours as part of a Southampton University GIS course. The study is funded by GEES.

Usability of Google Earth Materials in Education: I'm working with Declan De Paor from Old Dominion University and others on an NSF funded educational project where I'm providing input on usability issues. It's very early days on this project but Declan's examples give a good taste of what we're going to get up to.

China: I'm also off to China working with John Dearing and others where I'll be using Google Earth to communicate with Chinese farmers helping to alleviate poverty. Again, the project has yet to really kick off.

Next year is looking busy but exciting!

(update 26 Aug: Corrected Declan's surname spelling mistake)

Wednesday, August 4, 2010

Back Button, Places Column Tip

Back Button: As I move around in GEarth, GMaps and other mapping systems it occurred to me that I'd really like to have a back button to fly me back to the last view or back to the last placemark I looked at similar to the way a browser back button takes you back to the last page. You could have a whole history recorded like a GEarth tour which you could replay until you found the location you wanted.

Places Column Tip: There are 3 parts to the element listing in the GEarth places column which can be clicked with different effects. I use this most times I have GEarth open.


Thursday, July 29, 2010

Next Climate Change Talk

Here's the latest release from a series of climate change talks I'm doing, this one discusses the Gulf Oil spill, the Athabasca Oil Sands and climate change:


Unlike the earlier 'Is the Earth a Super Organism' talk I've released so far in this series, this one is completely based in GEarth. It's 10th in the series but I've released it early as:
  • The spill is still ongoing
  • I wanted to have a go at a talk completely in Google Earth to showcase my ideas of what a well designed tour should be like.
I've made a Prezi to link to other resources beyond the scope of the talk:


Good Design Points: A few reasons I think this is a well designed tour:
  • The tour covers views across a range of scales, this is where a tour really beats a traditional PowerPoint presentation
  • Simple Flights: The flights between segments are simple and fairly slow to give users chance to process the movement and work out where they are being taken.
  • Scale: I included Nelson's column, the outline of Great Britain (twice) and a 5 mile long at various points to fix a sense of scale. GEarth is very good at helping users grasp the scale of things.
  • Annotations: I use lots of annotations to draw the user's eye to the correct part of the screen.
  • Dateline: Because the inbuilt GEarth dateline is too small I included a custom dateline indicator.
Things I'd like to fix:
  • Dateline is too small: I fell into the classic trap of looking at GEarth on a large screen then reducing down to a 640 wide movie clip - you can't read the text easily.
  • Audio Hiccups: There are a few audio hiccups that I'd like to fix but these aren't easy in Camtasia without affecting the video. I've got to get a better mic too....
  • Better Images: There are a ton of better images I'd have liked to have used but I haven't got the time to ask permission. Every image used is cc marked and that limits choice.

Work Flow: To produce it I imported models, images, overlays etc. into GEarth then I recorded a tour visiting all the locations as I wanted. Using the pro version of GEarth, I then recorded a silent movie of the tour which I imported into Camtasia. Within Camtasia I added the audio section by section, using freeze frames to extend the movie where needed and cutting footage to fit the commentary. I also added 'call outs' the red annotations which work in addition to annotations I've added in Google Earth. Its not an elegant technique but it avoids issues to do with GEarth tours such as not being able to review changes easily and needing to edit kml code rather than use the Camtasia graphic interface.

Friday, July 23, 2010

12 Neo-Cartographic Tips for Developers

After releasing the Google Maps API styling features Googler Mano Marks commented:
"The truth is, we're mostly engineers, not cartographers. I'd love to see some great guides to how to style your map. Anyone want to give it a go?"
So here are my 12 best neo-cartographic tips:

Tips 1 to 6 (9.30)


Tips 7 to 12 (6.10)


Links out: There are various links out and other text and relationships shown in the clip, to access them you can navigate in the Prezi pane:


Other Notes:
  • Not Just Cartography: Mano's request was asking about the new style features. Actually only 2 of the tips [5 and 6] relate to the new feature because IMHO a holistic approach to map design is necessary so you have to consider usability, graphic design and interactivity as well.
  • Not Just for Developers: I aimed the material at developers but its a good introduction to design for anyone thinking of putting an interactive map together because I don't use any jargon.
  • Discussion of Styling: My post discussing the lack of cartographic advice that went with the styling feature release. Ed Parson's post is also relevant.