Thursday, May 20, 2010

Google Earth Tours in Geog. Teaching II

part I here. This is the second of three posts, this week I finish off the 'rules of virtual flight' section. Next post will cover audio, annotations, testing and use of layers.


c] Avoid complex camera movement: It is possible to fly out from a location while changing camera tilt, bearing and camera lattitude and longitude all at the same time. This can overload the viewers ability to follow where they are and which direction they are looking, the video above illustrates this: the first section shows a complex flight broken down into 3 separate sections where the camera first moves to point vertically downwards, then gains altitude, then changes position. The return flight changes view angle, position and altitude at the same time and confuses the user as to where they have been taken.

Some views are better with a tilted camera angle such as the one of mountain in the clip. If you haven't got a good reason to tilt the camera, a vertically down view is best.

d] North is Top: Country shapes are most recognizable to users with a 'North at top' orientation. If possible your camera angle should keep this bearing in flights.

e] Keep visual cues in view: It is easier for your users to follow where they are in a GET if you keep visual cues in view (e.g. coastlines, mountain ranges etc). If there are not useful visual cues in view, you can create some placemarks that will serve the same purpose, e.g. marking major cities on the tour route.

f] Smoothness: Flights should be smooth and jerkiness is to be avoided, commonly jerkiness is related to the power of the computer (principally the graphics card) and the Fly-to speed selected.

Practicalities: The considerations here concern setting the speed of flight and smoothness of flight. If you are creating placemarks to produce your tour (see tutorial 1 ) you can adjust the speed of virtual flight by Tools > Options > Navigation > Fly-to speed.

If you access Tools > Options > Touring > When recording a tour, you get a slider. Moving this slider to the right increases the smoothness of flight (by increasing the number of 'points' in space GEarth records) but will increase the size of file users will need to open to see your tour. For small tours, the size issue isn't usually an issue. Experiment with different settings to see the effect.


Wednesday, May 12, 2010

Google Earth Tours in Geog. Teaching I

This post is the first of three posts on the topic, I offer practical advice on how to use tours in geography teaching with links to specific tutorials where necessary. In today's post I will cover some best practices achievable with with simple tours.


Tours in Education: A tour is a pre-recorded virtual flight around a virtual globe (see example above) and has two strong applications in geography education: A teacher can use them in place of a PowerPoint presentation for part or all of a lesson and students can be set assignments or tasks that involve them producing their own tours.

Why Google Earth Tours? At the time of writing 'tours' are available in two virtual globes, Arc GIS Explorer (AGX) and Google Earth. In some ways AGX offers a richer way to create tours, for example slides from a PowerPoint presentation can be easily incorporated into the tour. However, Google Earth is arguably the better virtual globe and also has a tour audio feature which AGX lacks.

Best Practices: Many best practices in using GETs are the same as best practices for producing maps in Google Earth, for example, good icon design. In the following discussion we refer to best practices that apply mainly to producing GETs. They are arranged in rough order of complexity with the easiest to implement listed first.


1. Scale, Location and GETs A GET is best applied when displaying changes of scale and location. The above example shows an overview of the ships route before zooming in on the ship itself to add detail. If changes of scale and location are not important your narrative it is quicker and just as effective to use presentation software such as PowerPoint.

2. Rules of Thumb for GET Flights These section 2 best practices are part of a group about how to best move the camera viewpoint within a GET.

a] Looped Flight: It is possible to fly from location to location in a way that confuses the user. For example, if we were to position the user over a house in the UK and then fly them rapidly to a house in South Africa at a low altitude the user may fail to realise which country they have ended up in. If the flight path follows a looped path pausing at high altitude with both houses in view, the user has the opportunity to see that they have flown South over the Mediterranean before descending to South Africa.

To force the GET to fly high between two low points of interest simply fly to an appropriate high altitude camera position and insert an intermediate placemark, use of placemarks to control camera locations is explained here.

b] Think about speed: If a flight is too rapid the user might fail to realise where they have travelled to but if it's too slow you may lose their attention. This point is related to point [a] because if you keep visual cues in view the user can follow a quicker flight. This topic needs further research but for now, testing a tour out on a likely user is an effective way of assessing if you have the speed correct.

To be continued.


Wednesday, May 5, 2010

BBC Election Web Map and Gadget


UK Votes, Seats through time: I like this web gadget from the BBC, it combines a timeline, a pie chart (votes), a graph (seats in parliament) and video clips in a clever way so you can see how voting in UK elections has gone in the past. No map but I think they were right to leave it off in this case as it would have made the whole thing too complex. It shows nicely how our first past the post system has warped a minority vote into majority governments over the years. If you click the timeline from the left to the present day you can see how the liberal vote (including SDP/liberal alliance which then became liberal democrats) has grown over the years to today.


Change Blindness in Maps: I'm less impressed by BBC this map, its major problem is a lack of understanding about change blindness. Try and spot the changes in the images in this video


Change blindness demo from Breakfast Seminar Series on Vimeo.


you can see that our visual system is incredibly good at spotting small changes* in an image but that it doesn't work if a blank 'flicker' screen is inserted between changes. If you go to the BBC map and select different constituencies the map blanks the screen and flies you out and back in again. Not only is the flight back in unnecessary, the introduction of a blank screen hampers our visual memory to track changes.

*Interestingly, its an evolutionary adaption, spotting a small leaf twitching was the difference between being eaten by a lion trying to ambush you or getting away alive to our ancestors in Africa. Its also the reason you can find a flashing cursor on screen.


Friday, April 23, 2010

Nice BBC Election Map Gadget

A feature of UK elections is the swingometer, sent up wonderfully by the US daily show (9.10 mins in). Trouble is it only works for two parties, since that's all the competition has been about in most recent elections. For this election, suddenly its a 3 horse race between Liberal Democrats, Labour and the Conservatives. At short notice, the BBC have come up with a nice little tool, you drag a pie chart around to see how the percentage of the vote translates into seats in parliament. The map is quite clever, they've translated the constituencies into a pentagon representation which gets over the problem of urban constituencies being very small compared with rural ones.

I have a history of dissing the BBC's maps in twitters and on this blog so good to be able to cheer them on for once.

I'm off next week so no blog for at least a week.

Wednesday, April 21, 2010

Photos in Google Earth via Google Docs

A while back I posted about how to put photos in Google Earth pop-up balloons using a spreadsheet. Well, with the new Google Docs drawing tool it just got easier. Here's how to do it:

1] If you have an image on your PC, fine. If not, find an image on the web that you want to use (images on the web might have restrictions, creative commons search gets around this). Right click and select 'copy Image URL'.

2] Go to Google Docs . Click the 'Create New' button top left and select drawing. If you haven't got a Google login you'll need to set one up.

3] Click Insert>Image. If you have the image on your PC select 'Choose File' and select the image you want. If you are using a web image, click the chain icon labelled 'URL' and paste in the URL from [1]. If the pasted image does not fill the square, click it and drag the corner boxes so it does.

4] Click the share button top right then 'publish to web'>'start publishing'. If your screen image is large you might want to select the small image size from the 'Image Size' drop down menu. Copy the text from the embed code.

5] Open Google Earth, create a new placemark (the yellow map pin icon top left). Paste the text in the big 'Description' box then drag the 'New Placemark' dialogue out of the way and drag the flashing yellow box to where you want the placemark to be. Select OK.

6] Your placemark should now show your image when clicked.

Additional Things to do:
  • You can add annotations, text or titles to the image in step [3]. In fact, you don't even need the image, you could have a diagram to show.
  • Add a title to the placemark in step [5]
Notes:
  • If there are any alterations to the image in Google Docs it will show up in placemarks even if opened on another computer.
  • The images won't appear if you are offline, if this is important to you then use the spreadsheet system

Wednesday, April 14, 2010

Voluntered Geog. Info: Haiti and Teaching

This video is about how volunteers used satellite imagery to digitise roads, refugee camps and other infrastructure in Haiti following the earthquake.


IMHO its the most important instance of what is becoming known as VGI (Volunteered Geographic Information) yet to occur on the web. Those who organised it and those who just took part deserve a great deal of respect, I think we’re going to see a lot more mapping like this in future emergency situations and this was the first example. As they point out, key to this was the rapid publication of high quality satellite imagery.

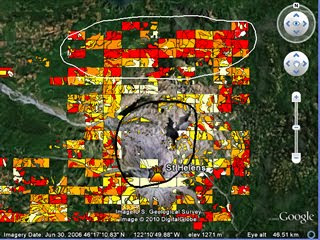
As it happens, I’ve just completed PolyMap a VGI based educational project for Southampton University where we got the students to create a thematic map via a web service based on Google Maps API* . They mapped tree cover around Mt St Helens volcano in USA to see how trees had recovered since the 1980 eruption, click the image to see a demo:


Thoughts for Others considering setting up VGI: Most of the following was obtained via written student feedback:
  • I gave students a background presentation of how VGI related to crowd sourcing and other VGI projects (here as a PDF), the students said this helped them realise what they were doing was a valid technique beyond the Mt St Helens problem. Could be useful as a motivator in non-educational situations?
  • I split the area into a grid and assigned them a square each. This helped in getting the entire area mapped although there was some problems with people working in the wrong square etc.
  • They complained that the classification scheme was difficult to apply whilst I had thought it was fairly simple and well explained. It goes to show that great care is needed in defining and then explaining classification schemes. My video tutorials on how to produce the map were very popular, fool proof documentation and instructions are well worth the investment of time.
  • They liked the fact that I collated the data and interpreted it in a presentation after they had finished and working in groups on a shared problem.
  • Advances in Google MyMaps since we started the project mean it would have been possible and much easier to do this project using Google MyMaps rather than the bespoke PolyMap service.
Other Educational Points:
  • Student feedback was the most positive feedback I've had for a long time!
  • The 1980 Mt St Helens eruption is a great topic to teach using technology, satellite images, youtube clips and photographs from USGS are out there in abundance. I think having an interesting context (the eruption) is possibly more important to the learning than the quality of the VGI data.

Thursday, April 8, 2010

ArcGIS.com: ESRI's neo-geography tool


Interesting talk by Jack Dangermond and colleague at Where 2.0 discussing their soon to be released web service: ArcGIS.com.

Background: The reception from the crowd is polite rather than 'stoked' which isn't surprising, this is a collection of neo-geographers (web based maps people) watching a talk from the major player of paleo-geography* desktop GIS.

I think its fair to say that ESRI (Jack's company) has failed to capitalize on the virtual globe or slippy maps (e.g. Google Maps ) market over the last 5 years and now they're playing catch up. Jack's statement that the distinction between neo-geography and GIS was disappearing was interesting, pretty much everything they demoed I'd classify as neo-geography rather than GIS - it was all user side features rather than producer side.
Interesting Features: There were a number of interesting features to the web service shown:
  1. Easy to search for maps from providers (Tree maps from Washington city)
  2. Easy to mash-up maps and create a new map (Tree maps and a chosen base map)
  3. Easy to share your map with a group or with the world
  4. Easy to add annotations to public services (here is a pot hole, please mend it Mr Government)
  5. Automatic integration with mobile devices (currently only iPhone)
  6. Presentation mode (earthquakes and aftershocks in Chile)
All the listed features are currently available on Google Maps and Google Earth. Google My Maps does 1 and 3, customisations of Google Maps do 4 and 5 while Google Earth does 2, 5 and 6. The possible strength of ArcGIS.com is that all these features come in one application. However, the devil is in the usability detail, I'll have to wait for the release to see if they have made it usable enough for the public, usability is a key reason why Google Earth/Maps have flourished so far, if ESRI haven't cracked this issue then I think the service isn't going to fly.

*edited 9th Apr: I didn't mean this to be disparaging just as the opposite of neo-geography