Wednesday, September 29, 2010

W3G Conference - like Geography only cooler

(Title of this post ripped and mixed from @DJSoup tweet)

A quick post on yesterday's W3G conference, I had a great time, there was a fantastic mix of NeoGeos, GISers and all kinds of other geo-philes kicking around ideas in a conference/
unconference format.

Highlights for me included:

Steve Feldman's fantastic rant (blogged here and here) about data that shouldn't be mapped. His line was that mapping some data doesn't do it any favours because a] it doesn't tell you anything worth knowing b] its misleading. He identified some twitter maps as culprit, like this map of tweets about the Gulf Oil Spill, I agree with him that this one doesn't pass the 'does mapping this add anything to understanding?' test.

Peter Batty's comments in his unconference slot about usability. As I said in my slot, I have been advocating Krug's 'Don't make me think' book and usability testing to all sorts of groups for years so it was excellent to see someone else making much the same points.

I also met Stuart and colleague from Geo.me who have a very impressive engine for fast production of bespoke maps. Well worth a look.

I gave a talk on techniques of clustering points mostly and expansion on this post. I think I misjudged the crowd with my approach but geo.me and Nick Bicanic made some interesting counter points to my argument so it was worth doing.

This was my first unconference and NeoGeo event, its noticeably a lot less stuffy than more mainstream conferences I go to which is great. Thanks to everyone who put it together.

Thursday, September 23, 2010

Cartography of Base Maps

updated 1 Oct to attribute the quote correctly

There's been an interesting cartographic discussion of base maps recently in the geo-blogosphere; Stamen Design blogged some notes about their work on Bing maps, which was picked up by 41Latitude which was in turn highlighted by James Fee. The point that comes out from this, as Justin O'Beirne says, is that

"in trying to make a base map that’s optimized for everything, we’re actually creating one that’s optimized for nothing."

Which I heartily agree with. An example is street names, if you are producing a map for city navigation street names are vital but if your map is a thematic one showing a heat map of crimes per square km, street names aren't important and should be removed. 41Latitude suggests having a range of base maps for different uses, this is sensible but of course you can go one step further: The new Google maps API allows you to customise the base map and of course, if you start with a really basic base map (say land and sea) of any service you can always produce a custom base map by adding specific layers (e.g. roads) as you see fit.

How Many Users: What no one so far has mentioned is that how much you customise a base map is really controlled by how much effort you want to put in. In turn, that is usually a factor of how many users you have and how complex your map is.

sketch map courtesy Rosanne Elkins-Bushnell

At one end of the scale, the proverbial 'back of an envelope' map has as its base map the envelope and works fine for a sketch of how to find a coffee shop for one person on a street. Showing a group of people the location of the hotel you're all meeting at works pretty well as a marker on a street map; my maps by google would be fine for this as the data can be displayed as a simple map. However, once you start having multiple layers with markers or polygons you really want to start thinking about improving your base map as screen clutter and usability becomes a real issue, especially if your map service is going to be used by many users and a client is paying you to put it together. You want to choose from a series of base maps to get the optimal base map or even customise it for your particular use.

Wednesday, September 15, 2010

10 Myth Busting Facts about Google Earth

Back from my trip to America now, whilst out there I met up with colleagues who also train teachers and students in using GEarth. Over beers a topic that often came up was misconceptions about Google Earth from those with no GIS or Google Earth experience, so I've put together my personal list of myth busting facts. They're in rough descending order of importance:

1] You can make your own map in GEarth. You can add points, lines or areas to Google Earth marking anything you want. Tutorial.

2] Google Earth isn't just satellite images and roads. There are lots of sets of data (called 'layers' because they are like a layer of see through plastic that can be turned on or off at will) you can look at draped over the background imagery of Google Earth. Examples include ; weather, Panoramio photos and shipwreck locations (Layers > Ocean > Shipwrecks) . Some of these layers come on automatically when you use Google Earth, you can turn layers on or off in the layers column as you wish. To cut down screen clutter I usually turn everything off apart from terrain.

3] Any map you make in Google Earth is not visible to anyone else unless you publish it. Just because you write a document in Microsoft Word it doesn't mean Microsoft can see it, it's exactly the same with anything you create in Google Earth. Background elements such as satellite images, roads and town names provided by Google are visible to all but add elements to Google Earth yourself and only you can see them.

4] You can publish your own map without going through Google. The layers column (bottom left of the screen in Google Earth) is a selection of materials that Google think lots of people will find useful but if you want to publish your own map by emailing it to people, or putting it on your web page you can just do it without checking with Google first.

5] The satellite data in Google Earth is historic, i.e. its not imagery taken today. Usually its a pretty recent image taken in the last 3 years.

6] Google does not censor satellite imagery. I can't say this for certain but stories appearing about Google censorship in the press are usually a misunderstanding based on age of imagery or the fact that Google buys a lot of its images from other agencies who may be doing the censorship themselves. See this post for details.

7] You can use Google Earth offline. Google Earth stores the satellite images of areas you visit on your hard drive in a special folder called a cache. If you've visited London in Google Earth you can then disconnect from the web and use Google Earth to look at London some more. Google Earth will do this by loading the images back in from the cache. If you then fly to Paris and zoom in Google Earth will just show you a fuzzy mess because it can't download the new imagery to produce Paris on screen until you connect up to the web again. This is very useful for presentations using Google Earth at conferences where you can't rely on wifi.

8] You can tilt the view to see mountains in 3D. A couple of years ago it was a common misconception that Google Earth was just 2D, many users didn't know you couldn't tilt the camera view and see the landscape in 3D. I'm not sure its such a common misunderstanding any more.

How To: tick the terrain layer in the layers column if you can see one, if you can't, don't worry. Hold the shift key down and use the up and down arrows on your keyboard to tilt .

9] Google Earth is not a security threat. Lots of scare stories have gone around about terrorists using Google Earth to plan attacks or thieves using it to set up robberies and that Google Earth should therefore be turned off or censored (see 6 above). It may be true that Google Earth is a tool for enemies of society but there are two main arguments against censoring Google Earth; firstly, satellite imagery has been available for sale to all comers for years before the appearance of Google Earth - if your security system relies on people not being able to see dated satellite imagery of your house, military instillation or city then it's never been very good security. Secondly, cars, mobile phones and pens are all used by terrorists and thieves, are we going to ban them too?

10] You can use Google Earth to explore other Planets, the Sky and History. Google Earth has lots of other features people users are usually unaware of, for example, you can use it to explore the surface of Mars, the Moon and the night sky. It also can be used to show historic imagery.

Thursday, September 9, 2010

3D Geology Models

I'm in Norfolk, Virginia working with Declan de Paor and team at Old Dominion University this week. I've already had a fascinating time looking at their latest work (see an old post for more details of the type of thing Declan does). An example is a model of the earth below Iceland, screen shot below.


The great thing about this project is that unlike most TEL (Technology Enhanced Learning) projects I've been involved in, the team here have a lot of technical examples working already and we're just starting! A lot of TEL projects start with a teaching idea without knowing how to produce it technically which means that little or no time is left to find out if the learning technology works as the team's time is absorbed in solving technical problems. So I think this project is really going to produce some excellent materials and push forward the use of Google Earth in education.

Google Earth API Use: One thing Declan's team are doing that I think is really clever is that they're using the GEarth API to reduce complication. Instead of having lots of controls like the compass control and layers panel in the GEarth client, they use the GEarth API showing only the controls that they need which simplifies the tool for students. Unfortunately they haven't published any examples yet but I'll point them out when they appear.

Wednesday, September 1, 2010

Google Earth for Scale: Colossus of Endlesham Road

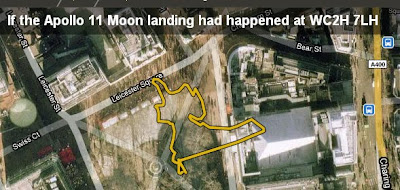
I really like howbigreally.com, a project by the BBC using google maps to illustrate the scale of things e.g. it puts the Apollo 11 moon walk into your local park.


The idea of sticking the statue of liberty or Nelson's column into a figure to show scale is nothing new and is something I do myself in Google Earth, e.g. UK outline vs Gulf oil spill . What's clever about howbigreally is the use of Google maps as a backdrop and some excellent choices of topics to illustrate.

Their examples are all of lengths and areas though, to illustrate the size of the statue of Colossus they show the statue's footprints. It made me think, this would work with 3D topics such as giant statues if it was done in Google Earth with sketchup models. I experimented and the rough and ready result is below:


The (Large 2 Mb) Google Earth file: Colussus

Putting a model in Google Earth to scale wasn't difficult but around where I live, the buildings aren't modelled in 3D so I combined a screenshot of the model in Google Earth with streetview imagery to show the statue in place.


HowTo:
1] Look up Colussus in the sketchup warehouse, (the one I use is courtesy of Goldie). If the model isn't in KMZ format already, load it into sketchup then export to Google Earth (HowTo). Obviously you can put any sketchup model in place, not just Colussus.

2] Once in Google Earth find the size of your model (I looked up Colussus on wikipedia), in this case I knew his height so I produced a placemark and gave it an altitude (in the edit Placemark box > Altitude tab > Relative to Ground (pull down menu), enter height in Altitude box and tick extend to ground box).

3] Right click the model in the places column and click properties. Move the camera until its looking down on the model, you can drag the green box corners, sides and central cross which will alter the size and position of the model. Do so until it matches the height of your placemark and is in the right position.

4] In the properties as above use the green diamond to rotate the model to the correct position.

Automating: Just as howbigreally automates areas and lengths against Google Maps, it would be possible to automate the position of a model like this in Google Earth and produce an automatic tour around it too.